Demystifying Hypothesis Testing in Statistics: Understanding Research and Null Hypotheses
140 likes | 247 Views
Learn how to craft research hypotheses, compare them to null hypotheses, and conduct hypothesis testing in statistics. Explore the significance of population vs. sample data and the logic behind hypothesis formation and testing.

Demystifying Hypothesis Testing in Statistics: Understanding Research and Null Hypotheses
E N D
Presentation Transcript
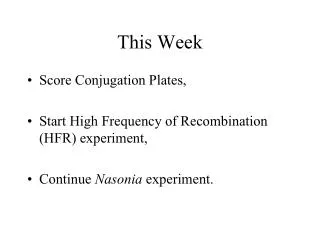
Grades after this week • Add up your points on test 1, quiz 1, participation, extra credit, and assignment 1 draft (possible 80 points) • Subtract from level you would like to be at • A: 374-416 points • B: 333-373 points • C: 291-332 points • D: 250-290 points • F: any score below 250 points • This is how many more points you need
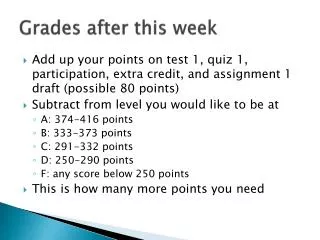
Points remaining • Tests – 150 • Lab attendance – 18 + 5 • Writing – 140 • Quizzes – 30 • Extra credit – 6 • Total = 349 left in the course
Student perceptions Percentage Score Grade Level
Student perceptions Percentage Score Grade Level
Intro to Stats Hypothesis Testing
Hypotheses • Educated guesses based on theory and past research • Translate a research question into a testable form • Depends on methods and measures • The hypothesis is formed with respect to a population --- but tested with a sample
Population vs. sample • Population-level: • Emotional intelligence training will improve children’s grades • BUT we don’t have access to all children • Sample-level: • A class of children in the 4th grade class at W. Elementary will have better grades in math class after undergoing EQ training than a similar class with no training
The Problem The hypothesis is formed with respect to a population --- but tested with a sample No sample ever perfectly represents the population (sampling error)
The Logic • We state the hypotheses • Predict sample characteristics • Obtain a random sample from the population • Compare the obtained sample data with the prediction made from the hypothesis
The Null (H0) • A formal hypothesis • Relates to the population • There is no relationship between variables (they are equal, not different, not related, etc.)
The Null • Acts as a starting point • Assume nothing until it is proven; null until proven significant • Benchmark against which outcomes are measured to ensure that chance is not a good explanation *Usually not stated in articles
Research Hypotheses • Statement that there is a relationship between the variables • Nondirectional • Unspecified difference/relationship • Directional • Specified difference/ relationship
Writing hypotheses • Make sure it is clear: • 1. which populations/groups are compared • 2. what the dependent variable is • (what is the measure/score about which the hypotheses are made?) • 3. the type and direction of the effect
Why Two? • Null hypotheses refer to the population; research hypotheses to the sample • Null hypotheses cannot be directly tested; research hypotheses can H0 : μ1 = μ2 H1 : X1 ≠ X2