Download
1 / 40
410 likes | 671 Views
Overview of Semiconductor Device Noise Research. Gijs Bosman Noise Research Laboratory NEB 585 Electrical and Computer Engineering Department, University of Florida, Gainesville FL, USA. Acknowledgements.

E N D
Overview of Semiconductor Device Noise Research Gijs Bosman Noise Research Laboratory NEB 585 Electrical and Computer Engineering Department, University of Florida, Gainesville FL, USA
Acknowledgements • PhD Graduate Students: Shehad Reza, Derek Martin, Frank Hou, Juan Sanchez, Jonghwan Lee, Jennifer Sippel, Robert Dieme • UG Student: Quyen T. Huynh • Colleagues: Professors Mark Law, Andrew Rinzler, Ant Ural, Toshi Nishida, and Jing Guo • Technical Assistance: Al Ogden • Funding and Support: Semiconductor Research Corporation, AMD, TI, HP
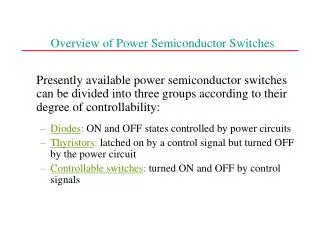
Outline • Introduction to Device Noise • Advanced NMOS drain noise • 1/f noise in carbon nanotubes • 1/f noise in silicon nanowires
For a simple, homogeneous resistor with length L, Ramo’s theorem describes the coupling between microscopic electronic motion and the measured current at a contact as where I(t)= IDC+dI(t), N(t)= NDC+dN(t) and vk(t)=<vk>+dvk(t) Phenomena that affect the noise; Ballistic versus scattering limited transport, surface and bulk traps, small N, high electric fields, quantum selection rules, etc. Physical Origin of Noise
Spectral Noise ComponentsS is spectral current or voltage density in A2/Hz or V2/Hz
1/f and 1/f-Like Noise • McWhorter: • Superposition of a large number of Lorentzian spectra, produced by g-r mechanisms. • The g-r noise is most likely caused by the trapping and de-trapping of carriers in surface and oxide traps. log S 1/f log f
1/f and 1/f-like noise • Defect related, McWhorter’s distributed generation-recombination noise model, 1/f and 1/f-like noise • Mobility fluctuations (phonon coupling), Hooge model, aH parameter, true 1/f noise only • Strongly technology dependent • Shows single defect/single electron phenomena such as Random Telegraph Signals • Contributes to jitter in VLSI clocking circuits • Limits the resolution of many sensors • Phase noise in VCOs • Limits the noise figure in the base band
Generation-Recombination Noise • Caused by random carrier transitions between continuum states (EC, EV) and localized defect states. • Defect related, determined by number of traps, energy levels, and carrier capture coefficients in bulk, oxide, and interfaces. • Distributed defects may produce 1/f-like noise via superposition of noise components • The same defects that produce noise play a role in leakage and reliability • Noise metrology: characterize electrically active defects in devices as made • Random Telegraph Signals: carrier trapping and detrapping in a small number of defects in a bottleneck device area may greatly affect charge transport (source-channel region of MOSFET) • Food chain in numerical simulation: Defect information via FLOOPS into FLOODS into Noise Post-Processor and vice versa
Velocity Fluctuation Noise • Caused by random carrier scattering with lattice waves, impurities and surfaces • Also known as Nyquist noise, Johnson noise, thermal noise, and diffusion noise. • Can not be removed by improving crystal quality • Typically determines noise figure at frequencies above 1 MHz • Shows up as shot noise in junction and mesoscopic devices • Allows for the measurement of the diffusivity as a function of electric field since
~ G K S g , gr V , gr Noise Modeling • Need to know • microscopic noise sources • transfer function that couples the noise strength from each differential volume to the terminals.
Spectral Density x2 x1 x1 x2 1/f Upconversion x 1/f Frequency Domain ( LF Noise) x 1/f2 fOSC Frequency Ecs x ft(1-ft) Integration of All Traps ET Ef Evs Ntrap Time Domain (RTS Noise for Single Trap) SiO2 Si Noise Sources in Advanced MOSFETs Physical Mechanism for LF Noise Gate Leakage Current Noise due to trap-related process Correlation Effects Slow traps Gate Fast traps Trap Oxide Coulomb scattering n+ Source n+ Drain Channel + Drain Current Noise due to number-mobility fluctuation Bulk GR Noise due to defects Depletion Region p-Substrate
Focus first onG-R Mechanism at SiO2/Si Surface • Carriers at the interface communicate with the traps in the oxide through tunneling. • Carriers first get trapped by the defect centers at the interface, then tunnel into the traps in the oxide at the same energy level. • Carrier tunneling is most efficient between trap centers that have the same energy position as the Fermi level at the interface. • Only the traps at that energy level need to be discretized to account for the tunneling effect.
Basic Equations At the interface: • Poisson: • ECE: • HCE: • Interface trap ECE In the oxide (at position xi): • Poisson’s: • Trap ECE:
N-channel MOS Transistor • Fabrication parameters input to the Florida Object Oriented Process Simulator, FLOOPS. • Generated doping profiles input to Florida Object Oriented Device Simulator, FLOODS with noise upgrade. • Accounts for drift-diffusion, impact ionization, generation-recombination noise in bulk and oxide layers, velocity fluctuation noise.
nMOSFET Simulation Doping Profile L = 0.4 um
Distributed Sid Distributed current noise spectral density for f = 1 Hz. (Vds = 2.0 V, Vgs = 0.8 V, dcrit = 22 Å)
x Oxide Noise Critical Region y SiO2 Graded Channel Doping Graded Channel NMOSReverse Engineering
Advanced nMOS Transistors • Measured long (2.33mmLG) and short (0.09mmLG) n-channel transistors, processed the same way, one set with SOI starting substrate, other set with bulk substrate material • Fabrication parameters input to the Florida Object Oriented Process Simulator, FLOOPS. • Generated doping profiles input to Florida Object Oriented Device Simulator, FLOODS with noise upgrade. • Accounts for drift-diffusion, impact ionization, generation-recombination noise in bulk and oxide layers, velocity fluctuation noise.
White: oxide Blue: n-type Si Yellow: p-type Si nMOS SOI Transistor G S D n+ poly n+ p+ n+ STI STI buried oxide p- Intensity of color ~ doping level NMOS SOI
3.2mm x 90nm bulk nMOSFET Simulated and measured current-voltage characteristic
3.2mm x 90nm bulk nMOSFET Measured and simulated noise data using a constant trap density in the oxide
3.2mm x 90nm bulk nMOSFET Graphical depiction of oxide trap locations on mesh for simulating the low frequency noise features. Location 1 has 4 traps, locations 2 and 3 0.5 traps each.
3.2mm x 90nm bulk nMOSFET Simulated and measured data
4.8mm x 90nm SOI nMOSFET Measured and simulated oxide and diffusion noise
Carbon Nanotube Properties • CVD grown, look like rolled up graphene sheets • Single-walled or multi-walled • Metallic (1/3) or semiconducting (2/3) • Diameter about 1 nm • SC energy gaps scale with 1/diameter • EG(eV)= 0.9/d(nm) • Mechanically robust (stronger than carbon steel) • Excellent heat conductors
Carbon Nanotube Geometry Always metallic (n,0): metallic if n is multiple of 3
CNT Device Cross-section • CVD grown on silicon wafers with 600 nm oxide layer • Lithography was used to pattern Cr/Pd (5nm/45nm) 500m long electrodes spaced 1 m apart. • Multiple CNTs connect between the contacts. • 1/3 of total number are expected to be metallic and the rest semiconducting.
Noise Spectrum R=9kW 2qI=1.410-26 A2/Hz 4kTG=1.810-24A2/Hz
Set-up for sequential ablation • Due to random nature of growth many CNTs connect between electrodes (Metallic ~1/3 and rest SC). • Isolation of single CNT is time consuming. • In the presented technique process variation is minimum. • Ablation occurred at, Vp ~17V, TW = 6mS, fr = 80Hz.
Conductance vs. Ablation • Note annealing after the first ablation attempt. • Large spread in the conductance of the individual ablated CNTs, but no clear trend.
Noise calculation • At·Gt2represents the lost noise (and conductance) contribution form the ablated CNT
Noise vs. Ablation • AG2 decreasing monotonically • Asi is two orders of magnitude higher than Ami
Si nanowire fabrication steps • Growth direction (111). • Dopant (Boron) is incorporated during growth process. • The diameter is much larger than CNT, around ~50nm. • Operates in bulk mode due to larger feature size.
A vs. • SI/I2=A/f is used • Note: lowest resistivity device also has lowest noise • So, lowest contact resistance devices have lowest noise
Noise Modeling Bulk noise Contact noise • For, Rc 0 Ri Rb At Ab. • Using Hooge’s model for bulk noise, • Now we are ready to calculate contact noise.
Summary silicon nanowires • Hb = 1.110-5 and 7.510-6 for wafer 1 and wafer 2 show high quality of the devices. • Contact noise dominant. • Most likely origin of the noise is the impinging end, where the contact is made through the native oxide layer thus expected to be defect rich. • The model fits the calculated contact noise well
Thanks ?
![Semiconductor Device Noise Models Based on Semiclassical Transport [5115-3]](https://cdn4.slideserve.com/661128/slide1-dt.jpg)