Download
1 / 20
200 likes | 363 Views
GEORGIA PORTS AUTHORITY: Preparing for Tomorrow’s Demands Today. Planning Associates Course Savannah Harbor Expansion Project. Hope Moorer Georgia Ports Authority May 19, 2011. GEORGIA PORTS AUTHORITY: National Economic Impact. The Economic Impact of Georgia’s Deepwater Ports.

E N D
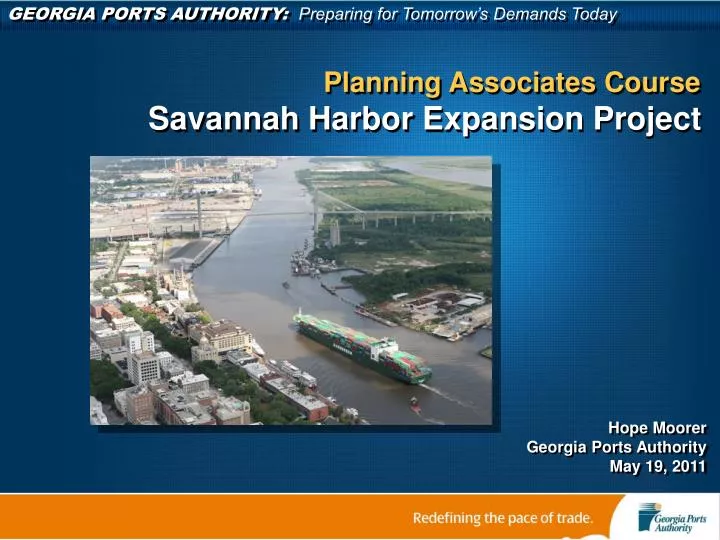
GEORGIA PORTS AUTHORITY: Preparing for Tomorrow’s Demands Today Planning Associates Course Savannah Harbor Expansion Project Hope Moorer Georgia Ports Authority May 19, 2011
GEORGIA PORTS AUTHORITY: National Economic Impact The Economic Impact of Georgia’s Deepwater Ports Nationwide* • In FY2010 the Port of Savannah moved 8.3% of total U.S. containerized trade and 18% of all U.S. East Coast containerized cargo. • The GPA handled 11.9% of total U.S. containerized exports in FY2010. • The Port of Savannah serves approximately 21,000 companies in all 50 states, 75% headquartered outside of Georgia. Statewide** 295,443 full- and part-time jobs* (7% of Georgia’s total employment) • $61.7 billion in sales • $26.8 billion in gross state product • $15.5 billion in income • $ 3.5 billion in federal taxes • $ 1.5 billion in state taxes • $ 1.1 billion in local taxes * Source: U.S. Department of Commerce – based on tonnage ** Source: Terry College of Business, University of Georgia, FY2009
PORT OF SAVANNAH: National Economic Impact Emergence of Suez Services Recession • 20.6% • 9.9% USWC Port Congestion • 14.3% USWC Port Closure • 22.6% Port of Savannah Container Throughput 12-year History by Calendar Year • 19.9 • 0.5% • 13.6% In Thousands of TEUs • 9.3% • 14.6% U.S. Economic Recession Source: GPA Marketing / EIS (loads & empties)
PORT OF SAVANNAH: National Economic Impact Top 10 U.S. Container Port Volume 2000 to 2010 (in 000 TEUs, loads & empties) 2000 2010 10-Year % Chg % Chg CAGR ’09 vs ’08 ’10 vs ’09 • Los Angeles 4,879 7,831 4.8% -14% 16% • Long Beach 4,600 6,263 3.1% -22% 24% • NY / NJ* 3,050 5,200 5.4% -13% 14% • Savannah 948 2,825 11.5% -10% 20% • Oakland 1,777 2,330 2.8% -8% 14% • Seattle 1,488 2,133 3.7% -7% 35% • Hampton Roads 1,347 1,895 3.4% -16% 9% • Houston 1,061 1,812 5.5% flat 1% • Tacoma 1,376 1,455 0.6% -17% -6% • Charleston 1,632 1,364 -1.8% -28% 16% • In 2000, Savannah ranked as the 10th largest U.S. container port in volume. • Savannah’s share of the total East Coast trade with Asia is 48%, up from 22% in 2000. • Savannah is currently the shallowest of all major U.S. ports. *Projection – 2010, Source: AAPA
PORT OF SAVANNAH: Shift in Trade to U.S. East Coast Port of Savannah Market Share 10-Year History by Fiscal Year Savannah has gained market share for the past decade, which continued during the U.S. Economic Recession. Percentage of Market Share Savannah vs. USEC U.S. Economic Recession Savannah vs. U.S. Source: PIERS – based on total loaded TEUs
PORT OF SAVANNAH: Critical Port for National Export Initiative Consistent Balanced Trade Calendar Year 2010: A Record Year for Exports \ Ten Year History CY 2010 2009 2008 2007 2006 2005 2004 2003 2002 2001 Exports 1,149,215 1,026,802 1,082,948 1,005,373 782,445 706,544 649,506 570,208 498,885 424,741 Imports 1,051,256 883,554 1,073,259 1,074,025 866,220 808,265 679,212 615,448 565,256 438,785 CY10 Exports (52.2%) 1,149,215 CY10 Imports (47.8%) 1,051,256 Source: EIS / Loads only
GEORGIA PORTS AUTHORITY: Export Opportunities via Savannah Garden City Terminal’s Top Export Commodities Fiscal Year 2010 * Food includes refrigerated cargo and containerized agricultural products Source: PIERS
PORT OF SAVANNAH: “Today” GPA, as ‘owner & operator’, provides flexibility & 24/7 cargo visibility. Source: GPA Engineering, April 2010
PORT OF SAVANNAH: “Tomorrow” Mason ICTF served by Norfolk Southern Railroad Chatham ICTF served by CSX Transportation • Chatham ICTF (CSX) • Mason ICTF (Norfolk Southern Railroad)
PORT OF SAVANNAH: Unmatched Transportation Connectivity Brampton Road Connector Jimmy Deloach Parkway Connector Mason ICTF / HWY 307 Overpass Grange Road Upgrade Garden City Terminal
PORT OF SAVANNAH:Largest concentration of Retail Import DCs along the East Coast • Atlantic Ocean Downtown Savannah Garden City Terminal • Electrolux • IKEA Target Icon H&F Heineken Lowes The Home Depot Dollar Tree Pier 1 Imports COBY Electronics
PORT OF SAVANNAH: Existing Industrial Properties • Garden City Terminal • Ocean Terminal • NorthPort • Sav. River Int’l Trade Pk • Crossroads Business Ctr. • Crossroads Expansion • Dean Forest Business Ctr. • CenterPoint Intermodal Ctr. • LogistiPort • Mega Site • Crossgate • WestPort • Georgia Commerce Ctr. • Tremont Intermodal Ctr. • Tradeport Business Ctr. • AMB Morgan Business Ctr. • Morgan Industrial Site • Savannah Logistics Park • Newton Tract • Rockingham Farms 3 15 6 4 11 5 1 16 18 12 7 17 19 8 2 9 10 13 14 Savannah Not reflective of all Savannah-area developments. 20
Sav - USEC Sav - USEC Asia via Panama 15 16 Asia/India/Mid East via Suez 7 9 North Europe 5 12 Oceania 2 2 Mediterranean 5 6 Latin America 9 18 43 Weekly Vessel Calls Covering All Major Trade Lanes Savannah’s Global Reach supports trade in 300-plus international ports (150-plus countries) Source: GPA Mktg. Last updated: Feb. 2011
PORT OF SAVANNAH: Preparing for Tomorrow’s Demands Today • 70% of U.S. consumers, or 215 million people, are east of a line drawn from Chicago to Dallas. • 70% of job-creating companies are also east of the same line. • The Port of Savannah is most strategically located to reach 44% of the U.S. population and 42% of all job-creating companies 44% Source: 2009 U.S. Census Estimates
SAVANNAH HARBOR EXPANSION PROJECT: Timeline PROJECT HISTORY Reconnaissance Study 1996 GPA completes Feasibility Study 1998 Chiefs Report Oct 1999 WRDA ’99 passes authorizing project Dec 1999 GPA begins GRR and Tier II EIS Dec 1999 GPA and Corps sign MOU July 2001 Corps NEPA Scoping Meeting Feb 2002 General Reevaluation Scoping Meeting July 2002 HQs Project Guidance Memorandum Oct 2002
SAVANNAH HARBOR EXPANSION PROJECT: Project Background • Project Authorized by Congress in WRDA 1999 conditioned upon following requirements: • Additional scientific studies & completion of a General Reevaluation • Report; • Analysis of incremental depths from 42 to 48 feet; • Approval not only by Secretary of the Army, but also by the Secretaries of Interior and Commerce and the Administrator of the EPA; and • The establishment of the Stakeholders Evaluation Group to assist in the identification of studies, as well as the creation of a consensus mitigation plan.
SAVANNAH HARBOR EXPANSION PROJECT: Required Study Work Completed Tasks • Biological Field Studies (wetland sampling & monitoring, fish studies) • Geotechnical studies and physical characterization of materials • Bank Stability Analysis • Beach Erosion Study • Coastal Erosion Additional Analysis • Formulation of Alternatives • Economic Analysis (fleet/commodity forecasts; multi-/region port anal) • CSS Georgia Archival Research • Dissolved Oxygen Impact Evaluation • Floridan Aquifer Supplemental Analysis • Sedimentation Analysis • Sediment Quality Analysis & HTRW Screening • Shortnose Sturgeon Study • Temporal and Spatial Distribution Study • Tidal Wetlands Study • Hurricane Surge Screening • Ship Wake Analysis • Model Development and Acceptance • Chloride Distribution Evaluation • Impact Analysis
SAVANNAH HARBOR EXPANSION PROJECT: Map of Project Boundaries
GEORGIA PORTS AUTHORITY: Preparing for Tomorrow’s Demands Today • Summary • The economic impact of Port of Savannah spreads throughout the nation. • Savannah is a critical port for the National Export Initiative. • Customer base unmatched on East Coast • Savannah has more space available than any other port on East Coast. • Road and rail connections are in place. • The nation needs to prepare its infrastructure for the shift in trade at completion of the Panama Canal • The Port of Savannah services 44% of the U.S. population. • Savannah is the 4th busiest and fastest growing port in the nation, yet it is has the shallowest draft of all major ports.