Download
1 / 18
180 likes | 304 Views
This presentation delves into innovative methods for generating runtime traces in .NET applications, focusing on non-intrusive techniques suitable for production environments. We explore the capabilities of the .NET Debugging and Profiling Infrastructure, discussing both debugger and profiler-based trace generation methods. Key topics include real-world applications, error detection, and the importance of avoiding side effects and human interaction. Future work direction and comparisons of different methods underline the potential of these techniques in both industry and academia.

E N D
Towards Effective Runtime Trace Generation Techniques in the .NET Framework Krisztián Pócza, Mihály Biczó, Zoltán Porkoláb Eötvös Loránd University, Budapest Faculty of Informatics Department of Programming Languages and Compilers
The structure of this presentation • Motivation, problem statement • Tools: .NET Debugging and Profiling Infrastructure • Trace generation using the debugger • Trace generation using the profiler • Comparing the methods • Future work
Motivation, problem statement • Usage in industry • Generate runtime trace during execution • Real-world applications in production environment • Non-intrusive • No development environment allowed • No debugging capabilities (no side effects) • No human interaction • Error detection • Usage in academy • Generate trace for program slicing • Identify statements that affect a variable at a given program location
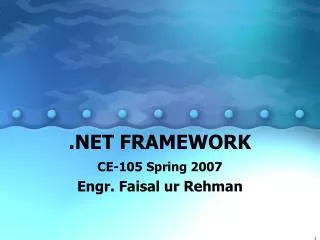
Symbol Manager Design time int. Profiler CLR Publisher .NET Debugging and Profiling Infrastructure • Design time interface • Debugging events • Different process • Notifications • Symbol manager • Interprets PDB files • Identification of program elements
Symbol Manager Design time int. Profiler CLR Publisher .NET Debugging and Profiling Infrastructure • Publisher • Enumerates runningmanaged processesin the system • Profiler • Events • Resource usage, CLR events (JIT, Load, GC, memory allocation, exceptions, etc.)
Trace generation using the debugger • Based on MDbg (corapi2, corapi) • Steps: • Create process under the control of the debugger • Set a breakpoint at the program entry point • Start the application • After reaching the breakpoint do Step-in operations
Trace generation using the debugger • What a debugging event (Step-in, breakpoint reached) does: • Sets evtComplete AutoResetEvent • Waits for evtModState AutoResetEvent • What the main program does in a while loop: • Waits for evtComplete AutoResetEvent • Generates trace about the current sequence point • Sets evtModState AutoResetEvent • Download: • http://avalon.inf.elte.hu/src/netdebug/default.aspx
Trace generation using the profiler • Technical background: • In-process • Implement a COM interface in C++ to handle profiler events • Environment variables must be set • The assembly metadata should be extended when loaded • Reference for methods generating trace - Tokens • ModuleLoadFinished profiler event • Requires IL Code Rewriting
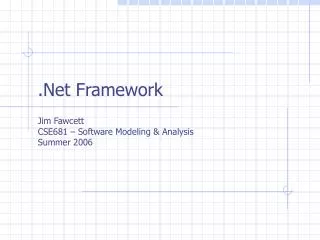
Tiny method Fat method Header IL Code SEH Header Ex. Hand. Clauses Padding byte Trace generation using the profiler • ClassLoadFinished • Profiler event • Visit all methods of theclass and rewrite • Method types • Tiny • Fat • IL Instruction types • No parameter, one integer parameter, token parameter, multiple parameters • Exception Handling Clauses (EHC) • Try, catch, finally
Trace generation using the profiler • Code Rewriting steps: • Query IL Code binary data • Break it at sequence points • Parse binary data and store it in custom data structures (binary representation of every IL instruction) • Upgrade method and instruction format (*) • Insert instrumentation code at every sequence point(*) • Recalculate offsets and lengths (*) • Store the new representation in binary format
Trace generation using the profiler • Upgrade method and instruction format • Problems while inserting new IL instructions: • Can break the limitations of tiny methods • Short branch instructions’ maximum relative length can be too short • EHCs’ representation of offset and length limitation can be too restrictive • Solution • Upgrade method format • Convert short branch instructions to long branch instructions • Store EHCs’ offset and length in DWORD instead of BYTE or WORD
Trace generation using the profiler • Insert instrumentation code at every SP • Template: • Substitute • 1-4 bytes, 6-9, etc. bytes with current line and column numbers BYTE insertFuncInst[31]; insertFuncInst[0] = 0x20; //ldc.i4, start line insertFuncInst[5] = 0x20; //ldc.i4, start column insertFuncInst[10] = 0x20; //ldc.i4, end line insertFuncInst[15] = 0x20; //ldc.i4, end column insertFuncInst[20] = 0x20; // ldc.i4, func. id insertFuncInst[25] = 0x0; // ldc.i4.1 or ldc.i4.2 insertFuncInst[26] = 0x28; // call *((DWORD *)(insertFuncInst+27)) =tracerDoFuncMethodTokenID;
Trace generation using the profiler • Recalculate offsets and lengths • Recalculate method length • Recalculate branch relative offsets • Point to the first instruction of the new sequence point if pointed to the first instruction of the old one • Point to the same instruction of the new sequence point if pointed to the not first instruction of the old one • Recalculate EHCs’ offset and length
Comparing the methods • None of them require us to modify the original source code • Differences:
Comparing the methods • Test results: • Advance with the Profiler
Future work • Variables of different types • Almost finished • Exception handling • Anonymous methods • Generic types • Application domains • Integrate with program slicing
Q&A Krisztián Pócza kpocza@kpocza.net Mihály Biczó mihaly.biczo@axelero.hu Zoltán Porkoláb gsd@elte.hu