
Analysis of IFN-2α Sensitivity in PANC-1 and AsPC-1 Pancreatic Cancer Cell Lines
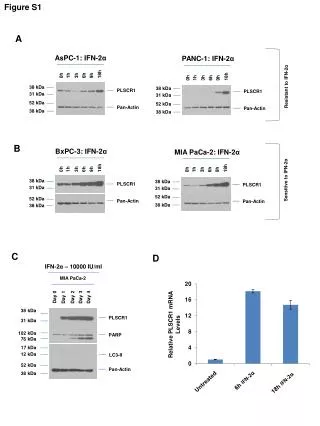
This study investigates the sensitivity of PANC-1, AsPC-1, and BxPC-3 pancreatic cancer cell lines to interferon-2α (IFN-2α) treatment over various time points (1h, 3h, 6h, 9h, 18h) and concentrations (3000, 5000, 10000 IU/ml). Through Western blot analysis, expression levels of PLSCR1, PARP, and LC3-II were measured to assess the effects of IFN-2α, revealing distinct profiles of IFN-2α resistance and sensitivity among the cell lines. The results contribute to understanding the differential responses to IFN-2α in pancreatic cancer therapy.

Analysis of IFN-2α Sensitivity in PANC-1 and AsPC-1 Pancreatic Cancer Cell Lines
E N D
Presentation Transcript
Figure S1 A PANC-1: IFN-2α AsPC-1: IFN-2α 6h 3h 9h 1h 6h 3h 9h 1h 0h 18h 0h 18h 38 kDa Resistant to IFN-2α 38 kDa PLSCR1 PLSCR1 31 kDa 31 kDa 52 kDa 52 kDa Pan-Actin Pan-Actin 38 kDa 38 kDa B Sensitive to IFN-2α BxPC-3: IFN-2α MIA PaCa-2: IFN-2α 6h 3h 9h 1h 6h 3h 9h 1h 0h 18h 0h 18h IFN-2α– 10000 IU/ml 38 kDa 38 kDa PLSCR1 PLSCR1 MIA PaCa-2 31 kDa 31 kDa Day 3 Day 2 52 kDa Day 4 Day 1 52 kDa Pan-Actin Pan-Actin Day 0 38 kDa 38 kDa C D 38 kDa PLSCR1 31 kDa 102 kDa PARP 76 kDa 17 kDa 12 kDa LC3-II 52 kDa Pan-Actin Relative PLSCR1 mRNA Levels 38 kDa 6h IFN-2α Untreated 18h IFN-2α
Figure S1 E Relative Growth Relative Growth Resistant to IFN-2α Untreated Untreated 3000 IU/ml 5000 IU/ml 3000 IU/ml 5000 IU/ml 10000 IU/ml 10000 IU/ml Day 1 Day 3 Day 5 F Relative Growth Relative Growth Sensitive to IFN-2α Untreated Untreated 3000 IU/ml 5000 IU/ml 3000 IU/ml 5000 IU/ml 10000 IU/ml 10000 IU/ml


