Download
1 / 23
260 likes | 473 Views
Sediment Transport Modelling Belgian part of the North Sea. Dries Van den Eynde, Michael Fettweis, Fritz Francken, Vera Van Lancker Management Unit of the North Sea Mathematical Models Jaak Monbaliu, Erik Toorman Katholieke Universiteit Leuven Job Janssens, Joris Vanlede, Toon Verwaest

E N D
Sediment Transport ModellingBelgian part of the North Sea Dries Van den Eynde, Michael Fettweis, Fritz Francken, Vera Van Lancker Management Unit of the North Sea Mathematical Models Jaak Monbaliu, Erik Toorman Katholieke Universiteit Leuven Job Janssens, Joris Vanlede, Toon Verwaest Flanders Hydraulics Research
Overview • Two sediment transport models • Transport of material in suspension MU-STM • Transport of sand MU-SEDIM • New developments • Bottom model • Flocculation model • Conclusions
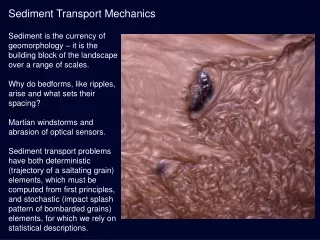
Sediment transport model mu-STM • Semi-Lagrangian model – based on Second Moment Method • Bottom stress under influence of currents and waves • Erosion and sedimentation • Consolidation model with different layers in the bottom • Boundary conditions • Applications • Dispersion of dumped material – optimisation of dredging works • Sediment balance for the Belgian Continental Shelf • Turbidity maximum is a natural phenomenon not caused by the dumping • Most of the material that enters the BCS from the Dover Strait, disappears to the North
Sediment transport model MU-SEDIM • Bottom stress as function of currents and waves: Bijker formula • Bottom roughness • Skin-friction, roughness by bottom load, roughness by bottom ripples • Shields-criterium for start of sediment transport • Different formulae for local total load • Ackers-White (1973) with adaptations of Swart (1976, 1977) • many different formulae available, results vary of orders of magnitude • Continuity for bottom: erosion and sedimentation • Applications • Modelling of volumetric changes of Kwintebank, assess effects of sand extraction • Modelling sediment transport at wind mill farms
Q4D Sediment transport model MU-STM Flocculation model Multi-classes MU-SEDIM Bed model Geological information Armouring Sand/mud layers
Fall velocity of flocs Stokes law Flocs with fractal structure (Winterwerp, 1998) p: density of primary particles grain size analysis, OM, CaCO3 of SPM sample (2580 kg/m³) w: density of water CT measurements Df: floc size LISST measurements Dp: primary particle size grain size analysis of SPM sample (1.8 µm - 7.2 µm) : molecular viscosity g : gravitation constant f: density of flocs nf : fractal dimension , : parameters of sphericity of flocs Re: floc Reynolds number
Flocculation models (settling velocity)Kwintebank: 2-11 March 2004
Bioflocculation model Maggi • Calculates floc formation and breakup under influence of turbulence, SPM, primary particle size, fractal dimension, organic fraction, biomass growth
Towards 2D model • Definition of the parameters over the BCP • Organic content • Other parameters
Geology - Tertiary and Quarternary clay Compact cohesive sediments in first m Fettweis et al. 2007. Mud origin, characterisation and human activities (MOCHA). Belgian Science Policy.
Biological activity and sediment erosion/stabilization Ensis directus (American jackknife clam) at Koksijde after a storm Invasive species Lives in great numbers and high densities in sandy substratum. Can be released due to extreme events (storm) Empty shells in high densities can form “reef” structures. Spatial extent of Ensis beds will be available by autumn ’09: Belgian Science Policy project ‘Ensis’ (2009-2011) Photo F. Kerkhof
Critical erosion shear stress measurementsVery soft consolidated mud (navigation channel) • Critical shear stress measurement: 0.5-4Pa (top), 4-9 Pa (rest) • Bulk density: 1.3-1.6 g/cm³ • (carried out by Westrich & Jancke, Stuttgart Univ.) Fluid mud on top, sandy with shell fragments; very soft mud with intercalation of sand layers
Bed model: parent bed – active bed • In order to incorporate erosion of old sediments the bed is split in active & parent part • Active layer: consist of different sub-layers to allow consolidation of mud, pore filling of sand by mud and segregation between sand/mud layers • Cohesive sediments (fine, mixed) • Active bed layers: ce < 4 Pa, sedimentation/erosion processes, • corresponds to recent sediments • Parent bed layer: ce > 4 Pa, only erosion processes, corresponds to • old sediments (Holocene, tertiary clays near surface) • Sandy sediments • active & passive layers
Bed model - variables • Erosion characteristics: • ceat surface • ce averaged over the depth interval • Density averaged over the depth interval • Mass over the depth interval • Critical erosion rate averaged over the depth interval • Maps are constructed based on geological constraints and erosion flume experiments Recent mud ce<4Pa Compact mud ce> 4Pa
Bed model - variables • Sediment characteristics: • 8 grain size classes from gravel to clay • Clay is defined as fraction <8 µm is based on the difference between sortable • silts and aggregated particles (Chang et al., 2007) • Cohesive – non cohesive behaviour is based on Van Ledden et al. (2004) adapted according to clay definition • Maps are constructed based on sedimentological data
Bed model - ternary diagram Van Ledden et al. (2004) Most sediments fall into I : non cohesive sand dominated II : cohesive mixed sediments III : non-cohesive mixed sediments IV : cohesive clay dominated
Conclusions • Flocculation model gives good predictions of the floc size • Dependent on geographical distribution of parameters like fractal dimension, … • Bed model: active and parent bed • Geological, sedimentological and erosion behaviour are included • Biological data: more data will become available • Further work: model simulations • Armouring • Different layers of sand / mud