Simplifying Risk Management: Assess, Organize, and Control
Understand the Risk Management Process, from initial assessment to cost estimation and mitigation strategies. Learn how to identify, prioritize, and evaluate risks for successful project planning and execution.

Simplifying Risk Management: Assess, Organize, and Control
E N D
Presentation Transcript
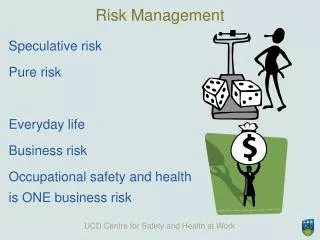
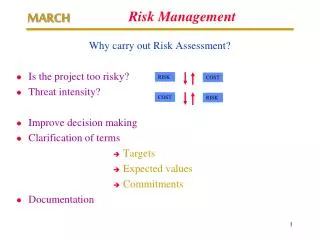
RISK COST COST RISK Risk Management Why carry out Risk Assessment? • Is the project too risky? • Threat intensity? • Improve decision making • Clarification of terms • Targets • Expected values • Commitments • Documentation
ORGANISE prioritise risks and responses DEFINE the project EVALUATE INITIATION DEFINE the risk management process OWNERSHIP risks responsibilities and contractors PLAN plans and strategies IDENTIFY risks and response ESTIMATE size the risks MANAGE Risk Management The Risk Management Process -RMP
0.3 A = area 0.2 Probability density A=0.35 0.1 A=0.2 A=0.15 A=0.1 A=0.1 A=0.05 A=0.05 2 4 6 8 10 12 14 16 Delay Risk Management Simple estimating of risk – more detail
1.0 0.12 + 0.33 + 0.25 0.8 0.12 + 0.33 + 0.25 + 0.24 0.6 0.12 + 0.33 Cumulative Probability 0.4 A and B, with B conditional on A 0.2 0.12 10 12 14 16 18 20 22 24 Delay Risk Management Cumulative probability graph
Risk Management Types of plans • Initial plan • Reference plan • Base plan • Contingency plan • Horizon plan • Action plan
Cost model With uncertainty Use of a range 3 - point estimate Task Cost Min Likely Max Distribution A 2 4 5 3.7 B 1 3 6 3.3 C 2 3 4 3.0 D 5 7 9 7.0 E 3 6 7 5.3 F 1 6 11 6.0 G 3 4 5 4.0 H 8 10 12 10.0 Total 25 43 59 41.3 Risk Management
Monte Carlo risk distribution Because of the values put into the model there will be zero risk of exceeding total cost ‘x’. All sample total costs will fall below value ‘x’. Hence, the risk is 1.0. Easy to see what target cost will have a 20% risk of being exceeded. Trying to set a target near the middle is sensitive to larger changes in the risk. 1.0 0.8 RISK OF EXCEEDING TARGET COST 0.6 0.4 0.2 0.0 TOTAL COST Risk Management X VALUE EXCEEDED BY 20% OF SAMPLE TARGET WITH 20% RISK OF BEING EXCEEDED
PROJECT TASK TRADITIONAL APPROACH USING RISK ASSESSMENT LIKELIHOOD AND IMPACT OF +VE AND –VE EVENTS 3 POINT ESTIMATE COST = £5000 DURATION= 3 WEEKS MODEL COSTS Risk Management
Risk Management Human relations • Benefits • Can make all aware of the risks involved, relieving the pressure on individuals • If you wait for more data it may be too late to act • Early assessment enhances bid and budget control • The plan can run during risk assessment • Can focus resources in high risk areas • Risk assessment can bolster confidence in the plan • One needs confidence that any costs will not exceed the bid price • May be client driven • May be stakeholder driven
(2, 3, 5) Task B FS FS (3, 5, 8) (3, 6, 8) SIMPLE NETWORK NO LAG Task D Task A (2, 4, 6) Task C Note 3 Note 1 Note 2 Risk Management