Download
1 / 10
110 likes | 142 Views
Learn about graphing linear equations, including slope-intercept form, standard form, and examples comparing graphs. Understand how slope and y-intercept relate to real-world scenarios.

E N D
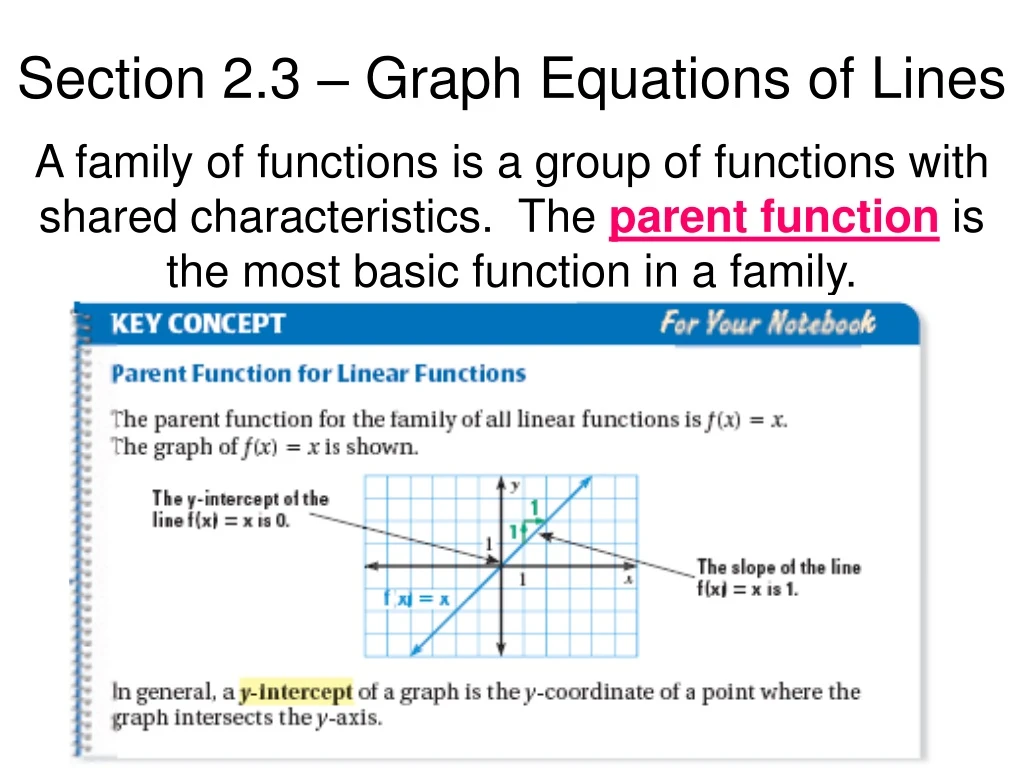
Section 2.3 – Graph Equations of Lines A family of functions is a group of functions with shared characteristics. The parent function is the most basic function in a family.
Section 2.3 – Graph Equations of Lines Example 1: Graph the equation. Compare the graph with the graph of y = x. a. y = 2x b. y = x + 3
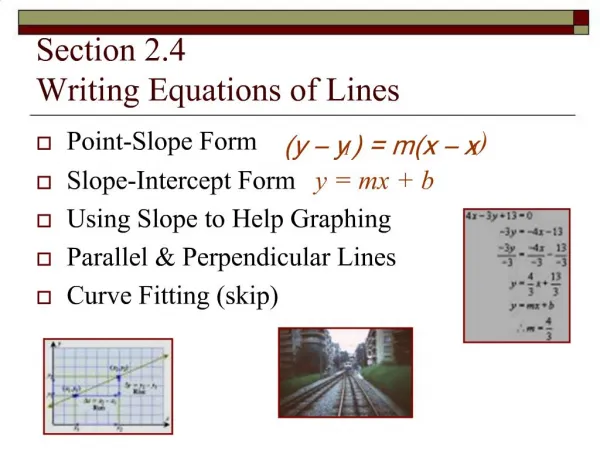
Section 2.3 – Graph Equations of Lines Slope-Intercept Form The equation y = mx + b is said to be in slope-intercept form.
Section 2.3 – Graph Equations of Lines Example 2: Graph the equation. Compare the graph with the graph of y = x. a. y = -2/3x – 1 b. y = 10 – x
Section 2.3 – Graph Equations of Lines Example 3: The body length y (in inches) of a walrus calf can be modeled by y = 5x + 42 where x is the calf’s age (in months). Graph the equation Describe what the slope and y-intercept represent in this situation Use the graph to estimate the body length of a calf that is 10 months old.
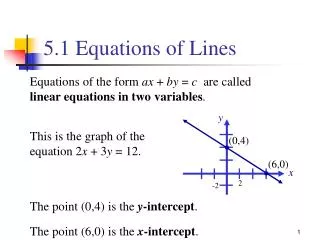
Section 2.3 – Graph Equations of Lines Standard Form The standard form of a linear equation is Ax + By = C where A and B are not both zero. You can graph the equation in standard form by identifying and plotting the x- and y- intercepts. An x-intercept is the x-coordinate of a point where a graph intersects the x-axis.
Section 2.3 – Graph Equations of Lines Example 4: Graph 5x + 2y = 10
Section 2.3 – Graph Equations of Lines Horizontal and Vertical Lines The equation of a vertical line cannot be written in slope-intercept form because the slope is not defined. However, every linear equation – even that of a vertical line – can be written in standard form.
Section 2.3 – Graph Equations of Lines Example 5: Graph the equations: a. y = 2 b. x = -3