Download
1 / 36
360 likes | 380 Views
The study investigates active red dwarf stars as sources of galactic cosmic rays up to 1014 eV. The telescopic observation data from dwarf stars V962 Tau, V780 Tau, V388 Cas, and V1589 Cyg reveal TeV gamma-ray emissions, suggesting these stars contribute to cosmic rays. The research challenges the prevailing view of supernovae explosions as the sole origin of galactic cosmic rays. Data from SHALON long-term observations support the detection of high-energy cosmic rays from active red dwarf stars. The study sheds light on the diverse sources of cosmic rays in the Galaxy, providing valuable insights into the complex nature of cosmic ray generation.

E N D
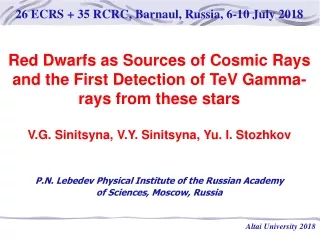
26 ECRS + 35 RCRC, Barnaul, Russia, 6-10 July 2018 Red Dwarfs as Sources of Cosmic Rays and the First Detection of TeV Gamma-rays from these stars V.G. Sinitsyna, V.Y. Sinitsyna, Yu. I. Stozhkov P.N. Lebedev Physical Institute of the Russian Academy of Sciences, Moscow, Russia Altai University 2018
Abstract The present point of view on the sources of cosmic rays in Galaxy considers explosions of supernovae as sources of these particles up to energies of 1017 eV. However, the experimental data obtained with Pamela, Fermi, AMS-02 spectrometers requires the existence of nearby sources of cosmic rays at the distances 1 kpc from the solar system. These sources could explain such experimental data as the growth of the ratio of galactic positrons to electrons with increase of their energy, the complex dependence of the exponent of proton and alpha energetic spectra, the appearance of anomaly component in cosmic rays and others.
We consider active dwarf stars as possible sources of galactic cosmic rays in energy range up to 1014 eV. These stars produce powerful stellar flares. The generation of high-energy cosmic rays has to be accompained by high-energy gamma-ray emission. Here we present the SHALON long-term observation data aimed to search for gamma-ray emission above 800 GeV from the active red dwarf stars. The data obtained during more than 10 years observations of the dwarf stars V962 Tau, V780 Tau, V388 Cas and V1589 Cyg were analyzed. The high-energy gamma-ray emission in the TeV energy range from the sources mentioned above was detected. This result confirms that active dwarf stars are also the sources of high-energy galactic cosmic rays.
Supernova explosions in Galaxy (the past 103 yrs) Supernova Year Distance, pc CR energy, erg Supernova 1006 Taurus -А (Crabnebula) 1054 1100 ~ 5·1048 Supernova 1181 Tycho Brage 1572 360 ~ 3·1046 Kepler 1604 1000 ~ 6·1046 Cassiopeya - А ~1680 3400 ~ 7·1049
In Galaxy supernova (2 type) explode each ~30 years and the 1 type supernova are each (100 – 200) years. The last SN Cas A exploded in 1680. From this year for the last ~330 years we have to observe ~10supernova explosions. But we observed not one.
Proton (left panel) and helium (right panel) spectra in the range 10 GV - 1.2 TV. The grey shaded area represents the estimated systematic uncertainty, the pink shaded area represents the contribution due to tracker alignment. The straight (green) lines represent fits with a single power law in the rigidity range 30 GV - 240 GV. The red curves represent the fit with a rigidity dependent power law (30-240 GV) and with a single power law above 240 GV. (O. Adriani, G. C. Barbarino, G. A. Bazilevskaya et al. arXiv.org > astro-ph > arXiv:1103.4055v1)
J(R) = AR- Protons Helium 30 – 80 GV 30 – 80 GV p = 2.801 0.007(stat) 0.002(syst) He = 2.71 0.01 0.002 80 – 230 GV80 – 240 GV p = 2.850 0.015 0.004 He = 2.766 0.01 0.027 > 232 GV> 243 GV p = 2.67 0.03 0.05 He = 2.477 0.06 0.03 R > 80 GV – 99.7% R > 80 GV – 95%
The AMS proton flux multiplied by R2.7 • and the total error as a function of rigidity. • The flux as a function of kinetic energy EK as multiplied by E2.7 compared with recent measurements. For the AMS results • EK ≡ [(Mp2 +R2)0.5 - Mp] where Mp is the proton mass. Energy interval: 45 GV – 1.8 TV. • (M. Aguilar, D. Aisa, B. Alpat et al. Precision Measurement of the Proton Flux in Primary Cosmic Rays from Rigidity 1 GV to 1.8 TV with the Alpha Magnetic Spectrometer on the International Space Station, PRL, 114, 171103 (2015))
The AMS proton flux multiplied by R 2.7as • a function of rigidity R. The solid curve indicates the fit to the data: • F =C(R/45 GV)[1 + (R/Ro)/s]s • where Ro = 336 GV, C = 0.4544, = -2.849, = 0.113, s = 0.024. • For illustration, the dashed curve uses the same fit values but with Δγ set to zero. • (b) The dependence of the proton flux • spectral index γ on rigidity R. • (M. Aguilar, D. Aisa, B. Alpat et al. Precision Measurement of the Proton Flux in Primary Cosmic Rays from Rigidity 1 GV to 1.8 TV with the Alpha Magnetic Spectrometer on the International Space Station, PRL, 114, 171103 (2015))
The major portion of galactic substance (stars, clouds of interstellar gas and dust) are in the galactic disk with the thicknessof ~ 300 pc and radiusof ~ (10 – 15) kpc.Halo volume (Rhalo = 10 kps) isVhalo = 1068 cm3.Disk volume is Vdisk = 1066cm3.Halogives (80 – 90)% of galactic radiosmissionNumber of stars in Galaxy:(2-4)1011 (stars with mass of the Sun, МSun = 1.99 1033g). The galactic nucleus (Rnucl 10 pc) has ~ 1.3107 stars withM = МSun.The main part of galactic mass are abundant in stars: МGal = 21011МSun 41044g.
In Galaxy supernovae of the 2nd type are exploded in each (30 – 50) years and the 1st type – in each (100 - 200) years. In galaxy disk cosmic ray energy density equals to WCR (0.3 - 1 ) eV/сm3 (for electrons Wе 3103 eV/сm3). The total energy of cosmic rays in galactic disk is WCR 1054ergs. The sources of CRs in Galaxy are the supernova explosions.
In Galaxy there are flare stars (weak and very weak stars). The density of these stars is ~0.056 stars/pc3. The total density of all stars is higher in ~ 2. These flare stars belong to the main sequence of stars, spectral classes of G – M. Characteristics of stellar flares: Temperature – (6000 – 2500) К Mass – (1 – 0.06) МSun Radius – (1 – 0.1) RSun Luminosity – (1 –0.0008) LSun
The spots on red dwarf stars were discovered in 1959 (optical observations). If the sunspot area on the Sun is 0.5 % of the total solar surface. This value on the red dwarfs can get from 10% to 90% of total stellar surface. The cycles in changes of stellar spot numbers were marked.
Dwarf stars – the stars of the main sequence of G-M spectral classes. Temperature – (6000 – 2500) К (red dwarfAU Mic, r = 9.9pc from the Sun, Тк = 4107 К) Masses – (1 – 0.06) М๏ Radii – (1 – 0.1) R๏ Luminosities – (2 – 0.0008) L๏ (L๏ = 3.86 1033 эрг/с)
The total spotness and flare activity on the red dwarfs are several orders greater than on the Sun. Magnetic fields on these stars can get ~ 20 kG. Solar flares have a duration from several minutes up to several hours and the total energy of solar flare optical emission is ~ (1026 - 1031) erg. Stellar flares were discovered as a result of the registration of X-ray emissionincreases.The increase of X-ray flux gives the information on the stellar (solar) flare start.
Stellar flares give the essential increase of X-ray flux, LX ~ (1030 - 1034) erg (in several orders greater than flares on the Sun). Red dwarfs have powerful stellar wind. The Sun losses ~ (10-14 - 10-15) M๏/year and red dwarfs loss ~ (10-11 - 10-12) M๏/year. Flare stars irradiate in Нandother emission lines, they have powerful X-ray radiation. During stellar flares the optical irradiation increases in several times up to ~ 1035erg [(1026 - 1031) erg from the solar flares]. The stellar flare duration is from several seconds up to tens of hours.
For example, stellar flare on 15 July 1992 on AU Mic had the duration of ~2 hours and energy released in UV- interval (65-190 Å) was 31034 ergs. During the next day another stellar flare on this star was detected with UV energy 21033 ergs. AU Michas the following characteristics: r = 9.9 pc, there are stellar spots, (RAU / R๏) 0.39, (MAU /M๏) 0.52, log LAU 32.38. On UV Get dwarf star the stellar flares are observed each hour. UV Get characteristics: r = 2.7 pc, stellar spots, (RUV / R๏) 0.16, (MUV/M๏) 0.1, log LUV 30.91. Now we have got more than 1200 flare stars with the number of flares > 4000.
Flare activity of the Sun is in 4 orders lower than the flare activity of the most active dwarf stars. The total energy of stellar flare can get about 31036erg (in comparison with ~1032erg from thesolar flare).
In Galaxy energy densities wH wGas wCR 0.5 eV/сm3. Total CR energy: WCR= wCRVGal 1054erg, whereVGal = 51066 сm3 – volume of galactic disk. WCR= Р1SnCR 1054erg. Let us take that the average power of stellar flare on dwarf star in cosmic rays is P1S 1035ergs and the flares occur in 3.5 days. Then Р1S 1037erg/year. The number of CR sources in Galaxy is nCR= кN = 21010 , whereN = 21011 – number of stars in Galaxy and к = 0.1 - coefficient.The CR life time in Galaxy is 107year. Then from the stellar flares on the red dwarfs we have WCR= Р1SnCR (1037erg/year) (107year) (21010 ), WCR 1054erg.
The first detection of TeV gamma-rays from Red Dwarfs The present point of view on the sources of cosmic rays in Galaxy considers explosions of supernovae as sources of these particles up to energies of 1017 eV. However, the experimental data obtained with Pamela, Fermi, AMS-02, spectrometers requires the existence of nearby sources of cosmic rays at the distances less then 1 kpc from the solar system. These sources could explain such experimental data as the growth of the ratio of galactic positrons to electrons with increase of their energy, the complex dependence of the exponent of the proton and alpha spectra from the energy of these particles, the appearance of anomaly component in cosmic rays. We consider active dwarf stars as possible sources of galactic cosmic rays in energy range up to 1014 eV. These stars produce powerful stellar flares. The generation of high-energy cosmic rays has to be accompanied by high-energy gamma-ray emission. Here we present the SHALON long-term observation data aimed to search for gamma-ray emission above 800 GeV from the active red dwarf stars. The data obtained during more than 10 years observations of the dwarf stars V962 Tau, V780 Tau, V388 Cas and V1589 Cyg were analyzed. The high-energy gamma-ray emission in the TeV energy range mostly of flaring type from the sources mentioned above was detected. This result confirms that active dwarf stars are also the sources of high-energy galactic cosmic rays.
V388 Cas (r ~ 10 pc) During the observations of Tycho’s SNR the SHALON field of viewcontains V388 Cas as it located at ~4.5o South from Tycho’s SNR . So due to the large telescopic field of view (~8o) the observations of Tycho’s SNR is naturally followed by the observations of V388 Cas flaring star. SHALON telescope field of view during the observation of Tycho’s SNR V388 Cas as a source accompanying to Tycho’s SNR was observed with SHALON telescope at the period from 1996 to 2010 for a total of 93 hours. The γ-ray source associated with the V388 Cas was detected above 1 TeV with a statistical significance 6.8σ determined by Li&Ma and with average gamma-ray flux: IV388Cas(>1TeV) = (0.84 0.19)10-12cm-2s-1. This source (V388 Cas ) produces –rays during stellar flares.
V388 Cas (r ~ 10 pc) V388 Cas as a source accompanying to Tycho’s SNR have been systematically observed with SHALON telescope during the clear moonless nights at zenith angles from 16o to 35o. The source of V388 Cas was detected above 0.8 TeV with a statistical significance 6.8σ. After data processing of the observation data we found that less 1% of showers were common for the both sources. It was made by the analysis of angular distance of arrival direction of these showers. This didn’t change the average flux of Tycho’s SNR. The shape of SHALON average differential spectrum of gamma rays from V388 Cas in the energy range from 0.8 to 25 TeV fits well to a soft power law: dN/dE = (0.910.22)10-12(Eγ./1 TeV)-2.520.15. A spectrum of flare is dN/dEFlare= (2.7 0.15)10-12(Eγ./1 TeV)-2.910.18 The -ray spectra of V388 Cas Emission map of V388 Cas by SHALON
V780 Tau and V962 Tau (r780 ~ 10 pc; r962 =…pc) V780 Tau and V962 Tau are flaring stars. V780 Tau is located at the distance of ~3о north from Crab and V962 Tau is of 2.5о east from Crab. These flaring stars as a sources accompanying to Crab were observed with SHALON telescope at the period from 1994 to 2014 for a total of 125.2 hrs at zenith angles from 15o to 35o. SHALON telescope field of view during the observation of Crab Nebula The average integral fluxes were: IV780Tau(>1TeV) = (0.23 0.03)10-12cm-2s-1 and IV962Tau(>1TeV) = (0.390.04)10-12cm-2s-1
V780 Tau (r ~ 10 pc) V780 Tau was detected above 0.8 TeV by SHALON with a statistical significance 6.1σ.After the procession of the Crab observation data we found that less than 1% of showers are common for Crab and V780 Tau sources. The separation of showers from sources was performed by the analysis of angular distance of arrival direction of these showers. In observations since 1994 the source of V780 Tau was found to be flaring source. The flaring spectrum was also extracting (). The shape of SHALON differential spectrum of -rays from V780 Tau in the energy range from 0.8 to 20 TeV fits well to a hard power law with an exponential cutoff: dN/dE = (0.21 0.08)10-12(Eγ/1 TeV)-2.510.15 A flaring spectrum: dN/dEFlare = (2.0 0.15)10-12 (Eγ/1TeV)-3.010.21 The -ray spectra of V780 Tau Emission map of V780 Tau
V962 Tau (r =…pc) V962 Tau was detected above 0.8 TeV by SHALON with a statistical significance 7.7σ. After the data processing we did not find that there are showers common for the both sources. The source of V962 Tau was also found to be not constant source. The flaring spectrum is presented with . The differential spectrum of -rays from V962 Tau in the energy range from 0.8 to 20 TeV fits well to a power law: dN/dE = (0.400.17)10-12(Eγ./1 TeV)-2.540.15 A flaring spectrum: dN/dEFlare= (2.8 0.45)10-12(Eγ./1TeV)-2.950.22 The -ray spectra of V962 Tau Emission map of V962 Tau by SHALON
V1589 Cyg (r ~ 27 pc) V1589 Cyg is located at the distance of ~2о west from Cyg X-3. So due to the large telescopic field of view >8o the observations of Cygnus-X are naturally followed by the tracing of V1589 Cyg. As a result, V1589 Cyg as a source accompanying to Cyg X-3 have been systematically observed with SHALON telescope (since 1995 up to 2016) during the clear moonless nights at zenith angles from 5o to 34o for a total of 303.5 hours. SHALON telescope field of view during the observation of Cyg X-3 In accordance with the program on long-term studies of microquasar Cygnus X-3 at very high energies, observations of Cygnus Region and its objects, including V1589 Cyg, as well as TeV J2032+4130 and γCygni SNR are being carried out with SHALON. With the data processing, V1589 Cyg was detected above 0.8 TeV by SHALON with the average integral flux : IV1589Cyg(>0.8TeV) = (0.13 0.019)10-12cm-2s-1
V1589 Cyg (r =…pc) The source of V1589 Cyg was detected above 0.8 TeV by SHALON with a statistical significance 6.5σ determined by Li&Ma method. We found that less than 2% of showers are common for the both sources. During long-term observation V1589 Cyg appeared as a source with changing flux. The flaring spectrum was also extracting and presented with . The shape of SHALON differential spectrum of -rays from V1589 Cyg in the energy range from 0.8 to 35 TeV fits well to a soft power law: dN/dE = (0.150.05)10-13(Eγ/1 TeV)-2.910.18 A flaring spectrum: dN/dEFlare = (1.7 0.45)10-12(Eγ/1TeV)-3.150.29 The -ray spectra of V1589 Cyg Emission map of V1589 Cyg by SHALON
Main sources of CRs in our Galaxy: - supernova explosions - stellar flares on active dwarf stars
The measured fluxes of elementary particles multiplied by |R|2.7. The antiproton flux (red,left axis) is compared to the proton flux (blue, left axis), the electron flux (purple, rightaxis), and the positron flux (green, right axis).The fluxes show different behaviour at lowrigidities, while at |R| above ~60 GV the functional behaviour of the antiproton, proton andpositron fluxes are nearly identical and distinctly different from the electron flux.
Proton (top points) and helium (bottom points) data measured by PAMELA in the rigidity range 1 GV - 1.2 TV. The shaded area represents the estimated systematic uncertainty. The lines represent the fit with a single power law and the Galprop and Zatsepin models.