Download
1 / 25
250 likes | 437 Views
LGC Forensics Jim Thomson STR DNA analysis of Cannabis Sativa. Background. Cannabis cultivation in the UK has increased significantly over the last decade

E N D
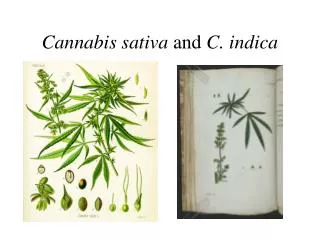
LGC Forensics Jim Thomson STR DNA analysis of Cannabis Sativa
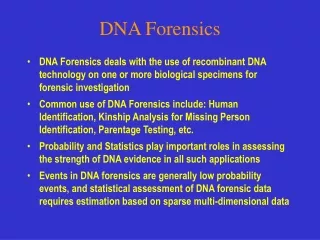
Background Cannabis cultivation in the UK has increased significantly over the last decade Much commercial growing is controlled by organised crime networks (OCN), often of Vietnamese origin, and frequently involved in other criminal activites. Grow rooms are highly efficient horticultural activities, often using hydroponic cultivation techniques Propagation is thought to be mainly achieved by taking cuttings from a productive mother plant, and distributions of cuttings within OCNs have been intercepted
Project outline Aim: To develop a DNA identification test for Cannabis capable of providing intelligence and evidence to link seizures and scenes (i.e. that two or more scenes have plants from the same genetic stock) Review of alternative DNA methods for identification of Cannabis samples Development and optimisation of Cannabis STR profiling method at LGC Forensics Confirmation of profiling method on known reference materials Population survey: stage 1. Collection and profiling of samples from local customer forces (Met, Surrey, Hants, Berks) Presentation to ACPO Drugs Committee November 2009 Population survey: stage 2. Collection and profiling of samples from across the UK (England, Wales, Scotland).
STRs are the best choice Variable STR regions directly equivalent to well established human identification methods (e.g. SGMplus) Process, instrumentation and interpretation methods well established at LGC Forensics Many published loci in Cannabis which have been developed in a number of laboratories Alternative methods (AFLP, RAPD) are less robust.
Cannabis STR loci • 1. Gilmore et al. For Sci Int 2003 • 2. Alghanim & Alimirall Anal Bioanal Chem 2003 • 3. Hsieh et al For Sci Int 2003 • 4. M. A. Mendoza et al. Anal Bioanal Chem., 2009
Example STR profiles:Mother plant and clone (cutting) A B CLONES HAVE IDENTICAL DNA
Project design • Optimisation of DNA Extraction • Mainly dried leaf samples • Some resin samples tested • LGC Genomics sbeadex® Plant DNA kit • Cannabis Samples • Phase 1 • Reference samples: 8 known mother plants and clonal offspring from cuttings • Seizures: 166 samples from 45 scenes in SE England • Phase 2 • Seizures: 422 samples from 115 scenes throughout England, Scotland and Wales
Profile Designation PROFILE C • Individual alleles were assigned in each profile • Complete profiles were assigned a unique identifier (A-EE) to aid interpretation and matching
Key Findings – Phase 1 166 full profiles from 45 scenes Full profiles from all samples tested, including mouldy leaf samples 42 unique profiles observed 38 scenes had 2 or more samples At 17 scenes, all plants from the scene shared the same profiles (indicative of clonal propagation of all plants from a common mother plant) At 12 scenes, all plants had one of two profiles (indicative of clonal propagation from two separate mother plants) At 9 scenes (with >2 samples), all plants had unique profiles, or at least 3 different profiles were observed (indicative of propagation by seed)
Significance of findings Profile B was found at 15/45 (33%) of scenes and in 49/166 (30%) of plants tested. Does this mean that all these scenes obtained their plants from a common mother plant, or that this profile is common in the wider Cannabis population? Do we see different commonly shared profiles in different geographical areas, as we might expect if distribution networks operate locally? Will the improved discrimination power of the additional 3 give distinguish between apparently common profiles in a larger population? MORE DATA NEEDED
Project phase 2 Integration of the 3 new tests with the 6 original to give a single test with 9 STRs. Validation of this new test. Collection of samples from UK police forces, supported by ACPO drugs committee At least 4 plants from each scene where possible Samples to be collected Jan – April 2010 Genotyping project to establish feasibility of a nationwide intelligence service.
Scenes and Samples – May 2010 • Samples received from 32 different forces in England, Scotland and Wales • A total of 1046 plants were sampled and submitted to LGC Forensics (av 3.2 plants/scene) • 173 of the 321 scenes had 4 or more individual plants submitted
Results 422 samples from 116 independent seizures from UK grow rooms were analysed. Samples were selected to give a wide geographical distribution and where possible from scenes where 4 individual plants were submitted. 110 distinct genotypes were detected; 96 unique to single seizures 14 shared among seizures. 3 genotypes (types B, C and X) were seen at multiple scenes (29, 23 and 12 different scenes respectively) 1 genotype (DN) was seen at 4 scenes (all in the Bristol area) 10 genotypes were each seen at a 2 scenes only.
97 Scenes with 4 samples analysed • Of the 97 scenes where 4 plants were submitted, 54 had all the plants from the scene sharing the same genotype Phase 2 – 54 scenes UK-wide Phase 1 – 17 scenes SE England 41% DN C, 24%
Seizures in England and WalesCommon genotypes seen at > 2 scenes106 different scenes Profile B – 23 scenes Profile C – 29 scenes Profile X – 12 scenes Profile DN – 4 scenes
Seizures in England and WalesAll genotypes106 different scenes Profiles seen once or twice only
Evidence or IntelligenceWhat is the significance of a match? Likelihood ratio: Pr(match if they are cuttings from the same motherplant [Hp]) Pr (match if they are “unrelated” [Hd]) Consider three scenarios: Two scenes, nominated as possibly linked, both have all plants with profile C, which has been previously observed at 25% of all crime scenes investigated. WEAK SUPPORT FOR Hp? Two scenes, nominated as possibly linked, both have all plants with profile DN, which has not previously been observed in 110 other scenes from around the UK. STRONG SUPPORT FOR Hp? Two scenes, nominated as possibly linked, have no profiles in common between them VERY STRONG SUPPORT FOR Hd?
Difficulties in estimating significance Human DNA Population frequencies can be estimated from nominally unrelated populations Substructure within populations is reasonable well characterised and can be accounted for All individuals are the result of sexual mating with 2 parents Individual tests are shown to be independent (on different chromosomes) Cannabis DNA The populations available through seizures are not unrelated Substructure (different distribution networks, different propagation techniques) is complex and unknown Both sexual (seeds) and asexual (cuttings) methods of propagation No knowledge of linkage of individual tests At present, we cannot calculate a reliable estimate to express the significance of a “match”
Further work 624 samples remain to be tested Improved data set, but still does not answer the difficult population questions Combining the results already obtained from phases 1 and 2 will provide a better picture for the South East of England A dense regional map of West Yorkshire may serve as a useful blueprint for future localised distribution maps 284 samples from 73 scenes Potentially the best model for future use – work with individual forces (or regions) to establish real distribution data.
Acknowledgements King’s College London MSc Forensic Science students Katherine Bache Vivian Yuen Yam All participating forces