Chart Components
Chart Components. 4.02 Understand charts and graphs used in business Revised by A. Moore 4-2012. Why do you need to learn about charts? . Why might you use a chart to present spreadsheet information? What does a chart do that a spreadsheet does not?. Data Series. Is it a chart or a graph?.

Chart Components
E N D
Presentation Transcript
Chart Components 4.02 Understand charts and graphs used in business Revised by A. Moore 4-2012
Why do you need to learn about charts? • Why might you use a chart to present spreadsheet information? • What does a chart do that a spreadsheet does not? 4.02 Understand charts and graphs used in business
Data Series Is it a chart or a graph? • A graph is a feature of a chart used to plot data. • The chart is the total package • Chart includes the title, value labels, and legend. 4.02 Understand charts and graphs used in business
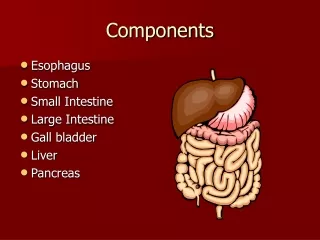
Examples of business uses of charts • To represent sales trends within the different departments of a store. • To represent the contribution of individual employee sales to the total sales for a company. • To represent the percent of each expense to total expenses. • To explain stock price fluctuations to stock holders. 4.02 Understand charts and graphs used in business
Data Marker Y-Axis X-Axis Components of Graphs & Charts • Y- axis - left vertical side; contains numerical data. • X-axis - bottom horizontal side; contains the category information. • Data markers –symbol in a chart that represents a single data point. 4.02 Understand charts and graphs used in business
Data Series Data Series • Related data points that make up a series that are plotted in a chart. 4.02 Understand charts and graphs used in business
Gridline Gridline • Horizontal or vertical line that extends across the plot area of the graph • Makes it easier to read and understand the values. 4.02 Understand charts and graphs used in business
Plot Area Plot Area • The rectangular area that includes the data series, category names, tick-mark labels, and axis titles). 4.02 Understand charts and graphs used in business
Tick Marks Tick Mark • Small lines, like divisions on a ruler, that intersect the axis. • Adds clarification to the data categories. 4.02 Understand charts and graphs used in business
Legend Legend • Box that identifies patterns, symbols, or colors in the chart 4.02 Understand charts and graphs used in business
Title Chart Title • Describes the purpose and content. 4.02 Understand charts and graphs used in business
Axis Titles Axis Titles • Describe the x axis (horizontal) and y axis (vertical) data. 4.02 Understand charts and graphs used in business
Data Labels Data Label • Single value or piece of data from the data series. • Adds extra information about the data marker. 4.02 Understand charts and graphs used in business
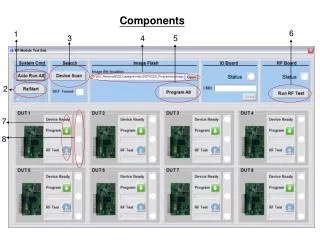
2. 1. 5. 3. 4. 7. 6. 10. 9. 8. Now it’s your turn! See if you can identify all of the components and describe their functions. 4.02 Understand charts and graphs used in business
2. 1. 5. 3. 4. 7. 6. 10. 9. 8. How’d you do? 1. Data Series 2. Chart Title 3. Y Axis Labels 4. Data Labels 5. Plot Area 6. Gridline 7. Legend 8. X Axis Labels 9. X Axis Title 10. Tick Mark 4.02 Understand charts and graphs used in business
Embedded vs. Separate • Embedded chart - placed on the same sheet you are working on rather than another worksheet. • Separate chart – (aka chart sheet) appears on a separate sheet. 4.02 Understand charts and graphs used in business
Linked Chart • A linked chart is one that will change to reflect changes made to the spreadsheet it represents. 4.02 Understand charts and graphs used in business
Chart Wizard Step-by-step process for creating a chart in Microsoft Excel. 4.02 Understand charts and graphs used in business
Bar (Column) Chart / Histograms Bar chart – uses bars to compare changes of two or more values over a period of time. Histogram - uses bars to represent frequency of numerical data organized in intervals (Ex: 0-20)
Stacked Bar Chart • Represents the contribution of individual items to a whole • Each bar is divided into two or more parts • The length of the stacked bar represents a total for any given month 4.02 Understand charts and graphs used in business
Line Chart • Line Chart- uses points connected by lines to show trends over time). • Example: Trends in sales of three stores within a three month period. 4.02 Understand charts and graphs used in business
5. XY Scatter Chart • Two value axes that • shows one set of • numerical data along • the x-axis and • another along the • y-axis. • Example: • Determines how • stress effect pulse rate . 4.02 Understand charts and graphs used in business
6. Pie • Represents the percentage each • item contributes • to the total. • Example: Highest sales percentages in Region 2 4.02 Understand charts and graphs used in business
Exploded Pie Chart Exploded Pie Chart - slice pulled away to draw attention or emphasize a point. 4.02 Understand charts and graphs used in business
WDYK…RYS…YIA • Put all notes away. • QUIETLY take out a sheet of notebook paper. • In the right corner: Write your fname, lname, class, and date. • Number your notebook paper from 1-10. • Now the fun begins 4.02 Understand charts and graphs used in business
2. 1. 5. 3. 4. 7. 6. 10. 9. 8. Identify each component. Chart title Data labels Data series Gridlines Legend Plot area Tick mark X axis labels X Axis title Y Axis labels 4.02 Understand charts and graphs used in business