Download

1 / 34
440 likes | 956 Views
Potential Energy Surfaces, Energy Minimization Methods, and Transition State Modeling. Outline. Potential Energy Surface (PES) Energy Minimization Methods (Algorithms) Global Minimum Structure Transition State Modeling Reaction Pathway Modeling. Potential Energy Surface.

E N D
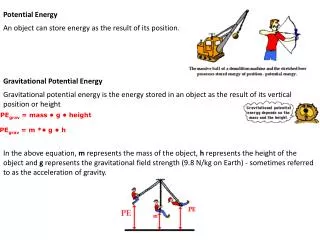
Potential Energy Surfaces, Energy Minimization Methods, and Transition State Modeling
Outline • Potential Energy Surface (PES) • Energy Minimization Methods (Algorithms) • Global Minimum Structure • Transition State Modeling • Reaction Pathway Modeling
Potential Energy Surface (a first order saddle point) (a first order saddle point)
Potential Energy Surface Terms • Gradient - the first derivative of the energy with respect to geometry (X, Y & Z); also termed the Force(strictly speaking, the negative of the gradient is the force) • Stationary Points - points on the PES where the gradient (or force) is zero; this includes Maxima, Minima, Transition States (which are first order saddle points),and higher orderSaddle Points.
PES Terms... • In order to distinguish among the latter, one must examine the second derivatives of the PES with respect to geometry; the matrix of these is termed a Hessian (or force) matrix. • Diagonalization of this matrix yields Eigenvectorswhich are normal modes of vibration; the Eigenvalues are proportional tothe square of the vibrational frequency. (IR spectra can be derived from these)
Sign of 2nd Derivatives • The sign of the second derivative can be used to distinguish between Maxima and Minimaon the PES • Minima on the PES have only positive eigenvalues (vibrational frequencies) • Maximaor Saddle Points(maximum in one direction but minimum in other directions) have one or more negative (imaginary) frequencies. • A frequency calculation must be performed to determine the sign of the vibrational frequencies.
Energy Only (Univariate) Method • Simplest to implement • Proceeds one direction until energy increases, then turns 90º, etc. • Least efficient • many steps • steps are not guided • Not used very much.
Steepest Descent Method • Simplest method in use • Follows most negative gradient (max. force) • Fastest method from a poor starting geometry • Converges slowly near the energy minimum • Can skip back and forth across a minimum.
Conjugate Gradient Method • Adds ‘history’ to simplicity of steepest descent method to implicitly gather 2nd derivative information to guide the search. • Variations on this procedure are the Fletcher-Reeves, the Davidon- Fletcher-Powell and the Polak-Ribiere methods.
Second Derivative Methods • The 2nd derivative of the energy with respect to X,Y,Z [the Hessian] determines the pathway. • Computationally more involved, but generally fast and reliable, esp. near the minimum. • Quasi-Newton, Newton-Raphson, block diagonal Newton-Raphson
Approaches to Locating the Global Minimum Energy Structure • Systematic Dihedral driving (manual or automatic) • Randomization-minimization (Monte Carlo) • Molecular dynamics (Newton’s laws of motion) • Simulated Annealing (reduce T during MD run) • Genetic Algorithms (start with a population of conformations; modify slightly; retain lowest energy ones, repeat) • Trial & error (poor) Methods are tedious, but absolutely necessary if the result is to be meaningful!
Caveats about Minimum Energy Structures • What does the global minimum energy structure really mean? • What other low energy conformations are accessible? (Boltzmann distribution/ensemble of conformations and probability/entropy considerations may be important). Some properties, such as dipole moment, are best computed as weighted averages of dipole moments of various contributing conformations. • m = 0.48 m1 + 0.27 m2 + 0.14 m3 + 0.10 m4 • For a molecule having four major conformations, contributing 48%, 27%, 14% and 10% respectively (Based on the Boltzmann distribution)
Caveats, cont’d. • Does reaction/interaction of interest necessarily occur via the lowest energy conformation? • As an example, a study of the solvolysis of some six-membered ring bromoamines shows that reaction can best occur via a high energy boat conformation:
Transition State Modeling • A Transition State is a stationary point for which the second derivative of the energy with respect to the reaction coordinate is negative, but second derivatives in all other directions are positive. • The T.S. is the highest point along the lowest energy pathway between reactants and products. • A frequency calculation on a transition state structure yields one and only one negative (imaginary) frequency.
Transition States; Why Difficult? • Reactants and products are well defined molecular entities; Transition States are not. • It is thought that T.S. exhibit elongated bonds, partial bonding, and may have some aspects of electronically excited states associated with them. • T.S. cannot be observed experimentally; therefore no parameters can be devised for modeling them.
TS Modeling Difficulties... • Mathematically, there is less attention paid to saddle points than to minima, so there are fewer algorithms available to locate them. • It is generally thought that the PES in the vicinity of the T.S. is ‘flatter’ than the surface near a minimum, therefore it may be more difficult to predict the structure of a transition state accurately. A single, unique T.S. structure may not even exist!
More TS Modeling Difficulties... • Because T.S. probably involve partial bonding, lower levels of theory are not likely to be very useful in modeling them accurately. • We ‘know’ relatively little about the geometry of T.S.; most of what we ‘know’ is based on calculation. Guessing T.S. geometries is more difficult than guessing the geometry of a stable structure.
Best Approach: Mixed Methods • “Guess” T.S. geometry (methods on next slide) • Perform a low level (AM1 or PM3) semi-empirical MO calculation as a transition structure. • Use that result as starting point for higher level (HF/3-21G or /6-31G*) calculation. • Verify with a frequency calculation at the same level of theory and basis set as the geometry optimization. (only one imaginary frequency, the animation of which is consistent with the rxn. step) • To get the “best” energy value, do single point energy calculation with a method that includes electron correlation (e.g., MP2)
“Guessing” a TS Geometry • Base the guess on a previously calculated, related system or ‘chemical intuition’ and a preconceived notion of the mechanism. • Use an ‘average’ of the reactant and product geometries (Linear Synchronous Transit method in Spartan or Gaussian). • Some programs employ a Quadratic Synchronous Transit method, in which minima perpendicular to the LST are connected. • Several attempts may be needed!
Confirming a Possible TS • Must be a first order saddle point on PES smoothly connecting reactant to product. • Verify that the Hessian (matrix of 2nd derivatives with respect to coordinates) yields one and only one negative (imaginary) frequency. • Animate the normal coordinate corresponding to the imaginary frequency; it should connect reactants and products (have vibrations consistent with expected bond breaking and bond forming).
Frequency Calculation • Keyword: Frequency,Freqor Frequencies • Output file has a table of frequencies listed in order of increasing magnitude; imaginaryfrequencies (negative; <0 cm-1) are listed first. • To animate a frequency in Titan, select Display, Vibrations, then check the box next to the frequency you wish to animate (you must first perform a frequency calculation.)
Do all Reactions have a TS? • No!!! There are numerous examples of barrier-less reaction pathways: • combination of radicals CH3. + CH3. CH3CH3 • addition of radicals to alkenes CH3. + CH2=CH2CH3CH2CH2. • gas phase addition of ions to neutral molecules
Effect of Solvent on Transition State Energy • Although there is insufficient experience to provide a general answer, it is known that in one important classes of reactions, SN2, the reaction profile is very different in solvent than in the gas phase. • In the SN2 reaction, solvent actually creates an energy barrier that is non-existent in the gas phase. • Obviously solvent can be very important and any gas-phase calculations of reaction energies should be used with caution when applied to condensed (liquid) phase chemistry.
Modeling a TS in Titan manually • Create model of product; minimize (MMFF) & save it. • Modify this model by constraining distances so as to stretch the bonds that are forming or breaking during the reaction to about 1.5 times their normal length. • Save under a new filename. Do a constrained geometry optimization. • Remove the constraints and perform a Transition State Geometry calculation.
Modeling a TS in Titan auto. • Create a model of the reactant (or product); minimize & save with a different filename. • Return to Build menu; select Reaction. Click in turn on pairs of adjoining bonds that undergo bond order changes in the reaction that you are modeling. Curved arrows appear as if you had written the reaction mechanism. • When all bonds have been selected, click on the reaction button ( ) at the bottom of the screen. This builds a guess at the transition state geometry from a library of optimized TSs.
Modeling a TS in Titan…(either) • Do a Transition State Geometry calculation at a higher level of theory or with a larger basis set as needed, requesting that frequencies be computed. • After optimization, examine the list of frequencies; animate the one imaginary frequency to confirm that it follows the reaction coordinate, i.e., the expected path between reactant and product. (the presence of more than one imaginary frequency indicates a higher order saddle point; if there are no imaginary frequencies, a minimum has been found)
Reaction Pathway Following Follows closely from T.S. modeling • Linear Synchronous Transit approach • Quadratic Synchronous Transit approach • Reaction Path Approach • 10 or so minimum energy points equally spaced between reactant and product • Walking Up Valleys (least steep ascent; may not lead to proper T.S.) • Steepest Descent (from T.S.)