Download
1 / 83
830 likes | 1.05k Views
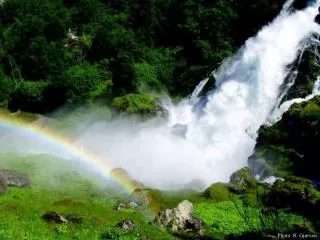
Photo: R. Gjørven. Greywater treatment and reuse. Professor Dr. P. D. Jenssen Norwegian University of Life Sciences (UMB). Ecological Sanitation Symposium, Damascus Syria , December 12. 2005. Source separation of wastewater. (Alsen and Jenssen2005). Source separation of wastewater.

E N D
Greywater treatment and reuse Professor Dr. P. D. Jenssen Norwegian University of Life Sciences (UMB) Ecological Sanitation Symposium, Damascus Syria, December 12. 2005
Source separation of wastewater (Alsen and Jenssen2005)
Source separation of wastewater (Alsen and Jenssen2005)
Presentation overview • Greywater production • Nutrients in waste fractions • Greywater composition • Greywater treatment and reuse
Nutrients and volume of domestic wastewater fractions (Vinnerås 2002).
Greywater volumes per capita and day (average from 18 investigations; 4 in poor and 14 in rich countries)
Greywater volumes per capita and day 60 - 110 liter 25 - 90 liters
Greywater composition (Jenssen et al. 2005a)
Greywater composition (Jenssen and Vråle 2004)
Greywater composition BOD/COD/SS concentrations as for combined wastewater Nutrients (nitrogen and phosphorus) substantially lower concentrations than for combined wastewater Pathogens (bacteria, viruses) substantially lower concentrations than for combined wastewater
Total nitrogen concentrations in greywater STE (mg/l) Average 8,4 mg/l (Jenssen and Vråle 2004)
Total nitrogen concentrations in greywater Norway (mg/l) Drinking water (WHO) 10,0 mg/l Average 8,4 mg/l (Jenssen and Vråle 2004)
Total phosphorus concentrations in greywater Norway (mg/l) Average 1,03 mg/l (Jenssen and Vråle 2004)
Greywater constituents relative concern • nitrogen • phosphorus • of the organic matter • bacteria + virus?
Greywater treatment options (Illustration: Jenssen et al. 2005)
Greywater treatment options (Illustration: Jenssen et al. 2005a)
BOD reduction Bacteria reduction
Membrane filtration of greywater ) Phota: P.D. Jenssen
Greywater treatment options (Illustration: Jenssen et al. 2005a)
Ponds at Tingvall conference center- Sweden • Three ponds in series removes: BOD 90% Total P 85% Total N 74% Bacteria normally good ( http://www.tingvalleko.com/ )
Greywater treatment options (Illustration: Jenssen et al. 2005a)
Infiltration systems Open systems - infiltration in ponds Subsurface (buried) systems - infiltration trenches Illustrations: Jenssen and Siegrist 1991 Photos: P.D. Jenssen
Infiltration systems - loading rates Open systems - infiltration in ponds 10 - 100 cm/d Subsurface (buried) systems - infiltration trenches 1 - 5 cm/d Illustrations: Jenssen and Siegrist 1991 Photos: P.D. Jenssen
1,3 2,0 Sorting ( d60/d10) 2,0 4,0 Mean grain size (d50) Loading rate assessment diagramMd/So (Meso) diagram K (m/d) L.R. (cm/d) 2 - 5 1.0 >5 2.0 (Jenssen & Siegrist 1991)
Large open infiltration system in a sand deposit Photo: K. Robertsen
Large buried infiltration system in a sand deposit Photo: K. Robertsen
Subsurface infiltration and sandfilter Sandfilter Trench Mound Photo: P.D. Jenssen PDJ 1999 Photos: P.D. Jenssen
A mound system Peilerør PDJ 1999 (Jenssen and Heistad 2000)
Buried infiltration systems (Siegristet al. 2000)
Buried infiltration systems Organic matter Bacteria Virus ? (Siegristet al. 2000)
Water treatment by filtration through sand (Photo: P.D. Jenssen)
Infiltration systems bacteria removal Soil surface Bacteria/100ml or 100g of soil Depth cm Infiltration trench E coli Total coli Total coli Total bacteria Cloggede zone (McCoy and Ziebell 1975) Background levels 30 cm below the trench
Treatment processes in natural systems Biological Chemical Mechanical Illustration P.D. Jenssen
Reduction of organic matterbiofilm media in activated sludge conventional systems K1* K2* Natrix O* d= 9 mm d= 15 mm d= 60 mm Biofilm media surface area 310 - 500 m2/m3 *Kaldnes TM
Reduction of organic matterPorous media as biofilm carrier Sand Lightweight aggregate Particle size 0.06 - 2 mm Particle size 2-5mm Photo: P.D. Jenssen Surface area > 5000m2/m Surface area >> 5000m2/m
Infiltration systems treatment efficiency BOD > 90% Total P >90% Total N 30 - 90% Bacteria - very good (Photo: P.D. Jenssen)
Greywater treatment options (P.D. Jenssen et al. 2005a)
Constructed wetlandwith subsurface flow (Illustration: T. Mæhlum)
Constructed wetland with integrated and separate pretreatment filter ( Jenssen and Heistad 2000)
Constructed wetland for one dwellling with WC (Illustration: Maxit Group)
The size ofthe horisontal subsurface flow wetland section based on 15 years of P-sorption Domestic WW: 7 - 9 m3/person Greywater: 2- 3m3/person 7 40 m2/family (Illustration: Maxit Group)
Greywater - 1/4 the area of greywater +WC (Photo: P.D. Jenssen)
Greywater treatment Pretreatment biofilter Pump/siphon Septic tank Level control & sampling port Horizontal subsurface flow wetland filter (Jenssen and Vråle 2004)
Constructed wetland at Dal primary school Norway Photos: P.D. Jenssen Parameter Influent Effluent mg/l mg/l Total - P 2,9 0,2 Total - N 29,0 12,0 COD 129 24 SS < 5 T. coli. /100ml < 2 (Jenssen et al. 2005b)