Download
1 / 45
530 likes | 739 Views
Financial Analysis Using Ratios. Agenda. Ratio analysis and EVA Briggs case Cash flow statement analysis Free cash flow. Four Analysis Categories. Evaluate performance relative to a peer group, and period-over-period, to identify strengths and weaknesses in four areas Profitability

E N D
Agenda • Ratio analysis and EVA • Briggs case • Cash flow statement analysis • Free cash flow
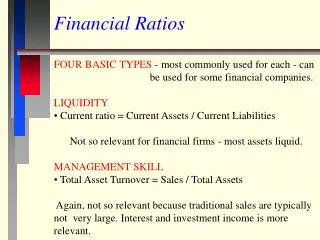
Four Analysis Categories • Evaluate performance relative to a peer group, and period-over-period, to identify strengths and weaknesses in four areas • Profitability • Asset management • Solvency risk • Economic Value-added
Key Uses of Ratio Analysis • Consider impact of financial performance on cash flow and stock price • Measure value-added • Set targets for projected performance to improve valuation • Assist in formulating a cash flow planning forecast
I. Profitability Traditional DuPont Model Adjusted DuPont Model Margin analysis
Traditional DuPont Model Margins On Sales Return on Assets Financial Leverage Return on Equity x x = Asset Utilization
Profitability summary using the Dupont Model ROE NPM TAT LR ROE = Return on Equity: rate of return to stockholders NPM = Net Profit Margin: efficiency in expense control (income statement) TAT = Total Asset turnover: asset management (balance sheet) LR = Leverage Ratio (‘financial leverage’; tradeoff is insolvency risk)
Return on Assets ROE ROA LR ROA = Return on Assets: summarizes income statement and balance sheet efficiency, before incorporating financial leverage
DuPont mixes operating and financial decisions A problem with this approach is that because net income is biased by financing choice, the equation provides a poor summary of operating performance (e.g. success in product positioning, production efficiency, distribution, overhead control, etc.) Companies with high debt have low net profit margin, low ROA, but higher ROE, all else equal
Traditional Balance Sheet Current Assets Current Liabilities PP&E Long-term Debt Stockhoders Equity = Total Assets = Total Liab + Equity • Our objective as financial managers is to enhance the value of the debt and equity capital that we’ve raised in the market, on which the investors require a rate of return. • Let’s show a balance sheet that isolates this investor capital.
Managerial Balance Sheet + Current Assets - Oper. Current Liab. + PP&E + Debt (L.T. + S.T.) + Equity = Invested Capital Net Working Capital = Invested Capital Invested Capital can be calculated both inside and outside the box
Net Working Capital (NWC) • NWC = Current Assets minus Operating Current Liabilities • Operating Current Liabilities • grow spontaneously with the firm’s assets • not motivated by a return on investment (non-interest) • include Accts Payable, Accrued Expenses, Tax Payable • exclude short-term interest-bearing debt that is part of current liabilities on the traditional balance sheet • This S.T. debt is now outside the box as a part of the Debt Capital
Invested Capital (IC) • IC is raised to acquire assets inside the box • IC = NWC + PP&E inside the box • IC also = Debt + Equity outside the box • The overall rate of return required by investors on the Invested Capital is known as theWeighted Average Cost of Capital
Net Operating Profit After Taxes This is the after-tax income earned on the Invested Capital • By using earnings before Interest to calculate NOPAT, we exclude the influence of debt funding on earnings • NOPAT is the net income that would be earned if there were no debt
Return on Invested Capital ROIC is a weighted return on Invested Capital: ROIC = ; rd=interest rate on debt Multiply both sides by:
Return on Invested Capital (ROIC) • ROIC intersects efficiency on the income statement with the productivity of assets on the balance sheet • ROIC provides a summary measure of operating performance • A financial performance analysis begins with ROIC, and drills down from there
Adjusted Dupont Model (isolates operating and financial leverage effects on ROE) rd = interest rate on debt Pure leverage effect • The second term isolates the increase in ROE resulting solely from leverage differences • This term also captures the tax break on interest (1-t) that we ignored when we calculated NOPAT
Adjusted Dupont Model [ ] + x - 5% (1-.40) [ ] 9% = 6% + 1.0 x 6% - 3% • From an operating perspective the companies are identical, earning a 6% ROIC • The levered company adds another 3% to its ROE as a result of its debt usage • Ultimately the answer to which is better depends largely on which debt mix is appropriate given the industry’s operating risk (variability in EBIT)
Increasing Leverage and ROE • Note that the hurdle rate for increasing ROE (same for EPS) by increasing leverage is very low: • ROIC > Int (1-T) • Returns to capital > after-tax cost of debt only • To increase value need ROIC > weighted average cost of debt and equity • Cost of both debt and equity are rising as debt increases • Goal should not be max ROE
Margin analysis Gross Margin: ability to mark-up product and control production expenses Net Operating Margin: control of overhead expenses (SG&A) as well
Profits Summary • Start with ROIC as a summary measure of operating performance • Explain ROIC results using • Margins on income statement • Capital turnovers from balance sheet • Explain ROE result using ROIC and Leverage • Also consider growth’s impact on value
Value Drivers The three keys to value are 1) ROIC; 2) growth in NOPAT; 3) Risk
II. Asset Management (turnovers) • Measure the efficiency with which the company invests in its assets (e.g. efficiency in collecting receivables, turning inventory, and utilizing PP&E capacity) Capital Turnover Accts. Receivable Days Inventory Holding Period Working Capital Turnover PP&E Turnover
III. Solvency risk • Measure whether the company has an appropriate level of debt in its capital mix, or the risk of becoming insolvent • Debt-to-EBITDA • Debt-to-Capital • Interest Coverage • or Times Interest Earned • Tradeoff: There are many considerations that drive this decision, but the primary tradeoff is that while higher debt increases insolvency risk and the cost of capital, it also can boost the return to stockholders (ROE).
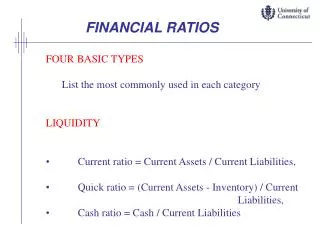
III. Solvency risk: Liquidity focus • Measure ability to meet near-term financial obligations by holding sufficient assets that are expected to convert to cash within the year • Inventory is the least liquid current asset, so exclude it in the quick ratio • Current ratio • Quick ratio
Liquidity interactions • Tradeoff: By shrinking the current ratio companies can reduce Invested Capital requirements and thereby boost ROIC • But a lower current ratio indicates greater liquidity risk • Liquidity can also be located off the balance sheet in committed unused lines of credit • Companies that have less total debt and/or have stronger cash flow can afford to have lower liquidity
IV. Economic Value Added • EVA is a measure of periodic economic profit, or single period $value-added to shareholders • Unlike Net Income, EVA measures residual income after deducting a charge for all of the Invested Capital used in the business (i.e. it charges for Equity capital) • Net income fails to effectively capture the cost of an inefficient balance sheet
EVA’s relation to value • Market value added, the difference between a company’s market value and its book value, is the present value of the company’s future expected EVAs • EVA links profit measurement to valuation • Net Present Value (NPV) for a new capital investment is equal to the present value of the investment’s future expected EVAs • EVA links profit measurement to capital budgeting
Value-based management using EVA • Focus managers on controlling capital investment and beating the cost of capital • “Incredibly, most corporate groups, divisions, and departments have no idea how much capital they tie up or what it costs”— Fortune • Provide appropriate incentives for value-added growth investments, while divesting value-destroying business lines • Push accountability for capital charges down into profit centers at all levels of organization • Optimize the use of debt to minimize WACC
Calculating EVA • EVA deducts a Capital (financing) Charge for the Investment Capital used to generate NOPAT • WACC = Weighted Average Cost of Capital • WACC is an estimate of the % return required by investors on the firm’s Invested Capital $Capital Charge
ROIC > WACC = +EVA • Investments must generate an ROIC that exceeds the cost of financing • $Capital captures the firm’s ability to find profitable growth opportunities • Recall that MVA is present value of future EVA • WACC captures risk • The EVA spread can be compared across firms, but do not target max EVA spread %
Overinvestment problem of net income focus • Assume capital structure is 50%/50% D/E: • Only need to earn ROIC > Interest (1-T) x 50%, which here is 3.5%, to increase Net Income; need 12% for breakeven EVA; result is overinvestment
EVA captures Equity cost risk effects not included in any measure of profitability, and encourages optimal capital structure • Captures differences in risk and associated financing cost side of the risk/return tradeoff via WACC • seek optimal use of debt to minimize WACC • include risk shifts in profit measurement • If use excessive debt to increase ROE, cost of Equity and Debt increase, resulting in higher WACC and capital charge in EVA calculation
Accounting adjustments • Adjusts capital for accounting distortions that understate capital (e.g. leases, reserves on balance sheet) or discourage investment (e.g. R&D, advertising, and training expenses)
Key terms • NOPAT • Invested Capital • ROIC • EVA • WACC