Download
1 / 25
250 likes | 346 Views
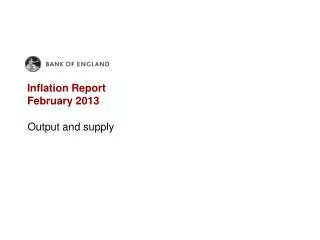
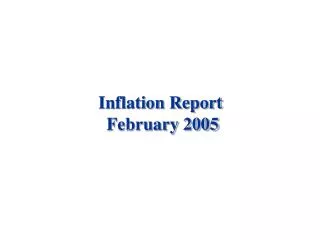
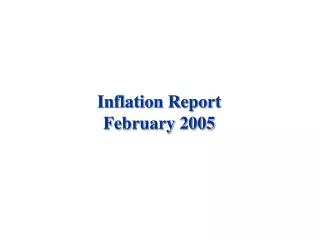
Inflation Report February 2009. Money and asset prices. Chart 1.1 Bank Rate and forward market interest rates (a). Sources: Bank of England and Bloomberg.

E N D
Inflation Report February 2009
Chart 1.1 Bank Rate and forward market interest rates(a) Sources: Bank of England and Bloomberg. (a) The February 2009, November 2008 and August 2008 curves are based on fifteen working day averages to 4 February, 5 November and 6 August respectively. At short maturities, the curves are based on overnight index swap (OIS) rates. At longer maturities, they are based on instruments that settle on Libor, adjusted for credit risk.
Chart 1.2Broad money and credit(a) (a) The measures exclude the bank deposits of, and borrowing by, intermediate OFCs, such as: mortgage and housing credit corporations; non-bank credit grantors; bank holding companies; and other activities auxiliary to financial intermediation. Bank staff have also adjusted these measures for some additional intragroup business, based on anecdotal information provided by a small sample of banks. For more information, see Burgess, S and Janssen, N (2007), ‘Proposals to modify the measurement of broad money in the United Kingdom: a user consultation’, Bank of England Quarterly Bulletin, Vol. 47, No. 3, pages 402–14.
Chart 1.3Major UK banks’ credit default swap premia(a) Sources: Markit Group Limited, Thomson Datastream, published accounts and Bank calculations. (a) The blue line shows a weighted average of the credit default swap premia of ten major UK banks, weighted by each bank’s share in total assets.
Chart 1.4Three-month interbank rates and spreads relative to future expected policy rates Sources: Bloomberg and Bank calculations. (a) Three-month Libor spread over equivalent-maturity overnight interest swap (OIS) rates. Dashed line shows average forward spreads derived from forward rate agreements over the fifteen working day averages to 4 February 2009.
Chart 1.5Major UK banks’ customer funding gap and overseas interbank deposits up to 2008 H1 Sources: Bank of England, Dealogic, published accounts and Bank calculations. (a) Customer lending less customer funding, where customer refers to all non-bank borrowers and depositors. (b) Data exclude Nationwide.
Chart 1.7Growth in loans to PNFCs(a) (a) Annualised percentage changes over the past three months. Data are non seasonally adjusted. (b) This group comprises Abbey, Barclays, HBOS, HSBC, Lloyds TSB and Royal Bank of Scotland. (c) Calculated as a residual.
Chart 1.8 Effective rates on new corporate borrowing Sources: Bank of England and Bloomberg. (a) Monthly average of daily data.
Chart 1.9Estimated decomposition of sterling-denominated investment-grade corporate bond spreads(a) Sources: Bloomberg, Merrill Lynch, Thomson Datastream and Bank calculations. (a) Option-adjusted spreads over government bond yields, decomposed into different factors using the model described in Webber, L and Churm, R (2007), ‘Decomposing corporate bond spreads’, Bank of England Quarterly Bulletin, Vol. 47, No. 4, pages 533–41.
Chart 1.10Credit Conditions Survey: changes in demand for corporate lending by purpose(a) (a) Weighted responses of lenders. A positive balance indicates an increase in demand for lending for that purpose.
Chart 1.11Growth in household net secured lending(a) (a) Annualised percentage changes over the past three months. Data are non seasonally adjusted. (b) This group comprises Abbey, Barclays, HBOS, HSBC, Lloyds TSB, Nationwide and Royal Bank of Scotland. (c) Calculated as a residual.
Chart 1.12Bank Rate and selected household quoted interest rates (a) Monthly averages of daily data to January 2009.
Chart 1.13HEW and financial asset accumulation (a) Households’ net acquisition of financial assets, excluding changes in assets held via insurance and pension funds. Four-quarter moving average measure as a percentage of households’ post-tax income. (b) Quarterly housing equity withdrawal as a percentage of post-tax income.
Chart 1.14Sterling effective exchange rate(a) Sources: Bank of England and Thomson Datastream. (a) The series is calculated from the IMF-based effective exchange rate between 1980 and 1975 and bilateral exchange rates against dollar, (synthetic) euro and yen prior to 1975. The latest observation is the average in the fifteen working days to 4 February.
Chart 1.15Consensus domestic demand growth forecasts for 2009(a) Sources: Bureau of Economic Analysis, Consensus Economics, Eurostat and ONS. (a) Revisions since January 2008 to Consensus expectations for the weighted sum of investment and private consumption growth in the United Kingdom in 2009 less that in the other country.
Chart 1.16Sterling ERI and Consensus expectations(a) Sources: Bank of England and Consensus Economics. (a) Expectations for the ERI are derived from bilateral US dollar, euro and yen exchange rates, weighted by UK trade shares in 2006. Expectations in the June 2007 and October 2008 surveys are for year ends. Expectations in the January 2009 survey are for 3 months’, 12 months’ and 24 months’ time.
Chart 1.17Sectoral equity prices(a) Sources: Thomson Datastream and Bank calculations. (a) The weight of each sector in the FTSE All-Share is shown in parentheses. (b) Includes mining, oil and utilities.
Chart 1.18Real property prices(a) Sources: Halifax, Investment Property Databank, Nationwide, ONS and Thomson Datastream. (a) Deflated using RPI index which has been calculated from annual inflation rates prior to 1987. Data are non seasonally adjusted. (b) Average of the Halifax and Nationwide measures from 1983 onwards. Prior to that, the Nationwide measure alone is used. The published Halifax index has been adjusted in 2002 by the Bank of England to account for a change in the method of calculation. (c) Annual data up to 1988 are shown in the dashed line. Thereafter quarterly indices are the average of monthly observations.
Chart 1.19Indicators of housing market activity Sources: Bank of England, Halifax, Home Builders Federation (HBF), Nationwide and Royal Institution of Chartered Surveyors (RICS). (a) HBF data have been seasonally adjusted by Bank staff.
Table 1.ACredit Conditions Survey: defaults and loss given default Net percentage balances(a) Averages 2008 2009 2007 Q2–2008 Q1 Q2 Q3 Q4 Q1(b) Secured lending to households Default rate 4 47 45 55 66 Loss given default 17 41 55 53 63 Lending to medium PNFCs Default rate 17 37 53 60 67 Loss given default 3 23 21 68 64 (a) Weighted responses of lenders. A positive balance implies increasing defaults and increasing losses given default. (b) Banks’ expectations for the following three months, reported in the 2008 Q4 survey.
Table 1.BEffective interest rates on stock of loans(a) Per cent Changes since Nov. Sep. 2008 (Nov. Inflation Report Inflation Report) Nov. 2008 Dec. 2008 (basis points) Households(b) 7.05 6.83 6.19 -86 of which: Secured 5.81 5.56 4.80 -101 Fixed 5.68 5.81 5.94 26 Variable 5.90 5.37 3.97 -193 Memo: SVR 6.95 6.34 5.38 -157 Corporates 6.85 6.09 5.13 -172 of which: Fixed 7.04 6.80 5.98 -106 Variable 6.67 5.57 4.46 -221 Overdrafts 6.94 5.74 4.89 -205 Memo: Bank Rate(c) 5.00 3.00 2.00 -300 Three-month Libor(d) 5.91 4.45 3.20 -271 Sources: Bank of England and Bloomberg. (a) Weighted average of interest rates paid on outstanding balances each month. (b) Includes secured borrowing, credit card borrowing, overdrafts and variable-rate products. (c) End-month observations. (d) Monthly averages.
Table 1.CLending to individuals Percentage changes on a year earlier Averages 2008 1996 to 2007 Oct. Nov. Dec. Total lending 10.2 4.7 4.1 3.6 Secured 9.5 4.5 3.9 3.4 Consumer credit 13.8 5.4 5.1 5.0 of which, credit card 18.0 8.0 8.2 7.4 of which, other unsecured 12.5 4.5 4.2 4.2