
RNA-Interference Knockdown of RBFOX1 in Cell Lines
This study examines the impact of RNA-interference knockdown of RBFOX1 in HeLa and PHNP cells. Immunoblotting and densitometry analysis were performed to assess protein expression levels. Results show significant changes in RBFOX1 expression with knockdown. Statistical analysis validates the findings.

RNA-Interference Knockdown of RBFOX1 in Cell Lines
E N D
Presentation Transcript
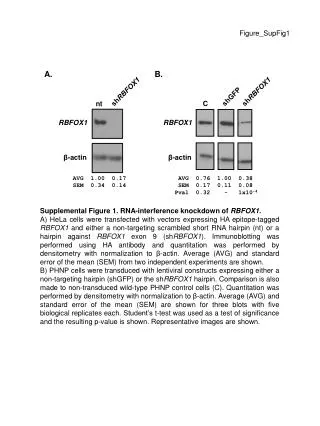
shRBFOX1 Figure_SupFig1 nt A. B. RBFOX1 shRBFOX1 shGFP C β-actin RBFOX1 AVG 1.00 0.17 SEM 0.34 0.14 β-actin AVG 0.76 1.00 0.38 SEM 0.17 0.11 0.08 Pval 0.32 - 1x10⁻⁴ Supplemental Figure 1. RNA-interference knockdown of RBFOX1. A) HeLa cells were transfected with vectors expressing HA epitope-tagged RBFOX1 and either a non-targeting scrambled short RNA hairpin (nt) or a hairpin against RBFOX1 exon 9 (shRBFOX1). Immunoblotting was performed using HA antibody and quantitation was performed by densitometry with normalization to β-actin. Average (AVG) and standard error of the mean (SEM) from two independent experiments are shown. B) PHNP cells were transduced with lentiviral constructs expressing either a non-targeting hairpin (shGFP) or the shRBFOX1 hairpin. Comparison is also made to non-transduced wild-type PHNP control cells (C). Quantitation was performed by densitometry with normalization to β-actin. Average (AVG) and standard error of the mean (SEM) are shown for three blots with five biological replicates each. Student’s t-test was used as a test of significance and the resulting p-value is shown. Representative images are shown.