
Download
1 / 3
Download Presentation 
An Image/Link below is provided (as is) to download presentation
Download Policy: Content on the Website is provided to you AS IS for your information and personal use and may not be sold / licensed / shared on other websites without getting consent from its author.
Content is provided to you AS IS for your information and personal use only.
Download presentation by click this link.
While downloading, if for some reason you are not able to download a presentation, the publisher may have deleted the file from their server.
During download, if you can't get a presentation, the file might be deleted by the publisher.
E N D
Presentation Transcript
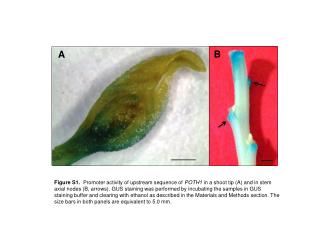
B A Figure S1. Promoter activity of upstream sequence of POTH1 in a shoot tip (A) and in stem axial nodes (B, arrows). GUS staining was performed by incubating the samples in GUS staining buffer and clearing with ethanol as described in the Materials and Methods section. The size bars in both panels are equivalent to 5.0 mm.
Figure S2. promPOTH1::GUS transgenic plants were incubated under long day (16h light, 8h dark) and short day (8h light, 16h dark) photoperiods for four weeks and GUS activity was quantified by MUG assay.
Table S1. Summary of light motifs identified in the upstream sequence (1627 nt) of POTH1 using the promoter analysis software plantPAN (Chang et al. 2008) and PLACE (Higo et al. 1999).
More Related