5.7 Quadratic Inequalities
150 likes | 408 Views
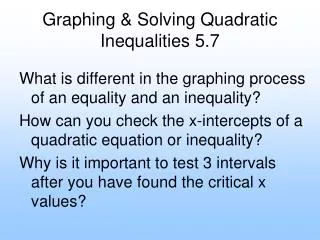
5.7 Quadratic Inequalities. y < ax 2 + bx + c y > ax 2 + bx + c y ≤ ax 2 + bx + c y ≥ ax 2 + bx + c. You have already solved linear inequalities in two variables by graphing. You can use a similar procedure to graph quadratic inequalities.

5.7 Quadratic Inequalities
E N D
Presentation Transcript
y < ax2 + bx + c y > ax2 + bx + c y ≤ ax2 + bx + c y ≥ ax2 + bx + c You have already solved linear inequalities in two variables by graphing. You can use a similar procedure to graph quadratic inequalities.
Graph y ≥ x2 – 7x + 10. Step 1 Graph the boundary of the related parabola y = x2 – 7x + 10 with a solid curve. Its y-intercept is 10, its vertex is (3.5, –2.25), and its x-intercepts are 2 and 5.
Step 2 Shade above the parabola because the solution consists of y-values greater than those on the parabola for corresponding x-values.
Graph the inequality. y ≥ 2x2 – 5x – 2
Whiteboards Graph each inequality. y < –3x2 – 6x – 7
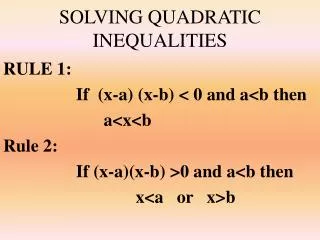
Reading Math For and statements, both of the conditions must be true. For or statements, at leastone of the conditions must be true. Quadratic inequalities in one variable, such as ax2 + bx + c > 0 (a ≠ 0), have solutions in one variable that are graphed on a number line.
You now need a calculator (graphing, of course) Solve the inequality by using tables or graphs. x2 + 8x + 20 ≥ 5 Use a graphing calculator to graph each side of the inequality. Set Y1 equal to x2 + 8x + 20 and Y2 equal to 5. Identify the values of x for which Y1≥ Y2.
–6 –4 –2 0 2 4 6 Continued The parabola is at or above the line when x is less than or equal to –5 or greater than or equal to –3. So, the solution set is x ≤ –5 or x ≥ –3 or (–∞, –5] U [–3, ∞). The table supports your answer. The number line shows the solution set.
–6 –4 –2 0 2 4 6 Now you try Solve the inequality by using tables and graph. x2 + 8x + 20 < 5 The solution set is–5 < x < –3 or (–5, –3).
The number lines showing the solution sets in the last example are divided into three distinct regions by the points –5 and –3. These points are called critical values. By finding the critical values, you can solve quadratic inequalities algebraically.
–6 –4 –2 0 2 4 6 Whiteboards Solve the inequality by using tables and graph. 2x2 – 5x + 1 ≥ 1 The solution set is(–∞, 0] or [2.5, ∞)
Solving Quadratic Inequalities algebraically Solve the inequality x2 – 10x + 18 ≤ –3 by using algebra. Step 1 Write the related equation. x2 – 10x + 18 = –3
Example 3 Continued Step 2 Solve the equation for x to find the critical values. x2 –10x+ 21 = 0 Write in standard form. (x– 3)(x – 7) = 0 Factor. Zero Product Property. x– 3 = 0 or x – 7 = 0 Solve for x. x=3 or x = 7 The critical values are 3 and 7. The critical values divide the number line into three intervals: x ≤ 3, 3 ≤ x ≤ 7, x ≥ 7.