Engaging with Data: Excel Surveys and Graphing for Revolutionary War Insights
This project explores the use of Excel for creating surveys and graphing results related to the Revolutionary War. Students developed their own questions about favorite figures, crucial colonies, significant events, and important documents of the era. Following online polling and data collection from classmates, friends, and family, they analyzed the gathered information, created charts, and presented their findings. Through this process, students learned the importance of data representation, customization of graphs, and the effectiveness of Excel in organizing information.

Engaging with Data: Excel Surveys and Graphing for Revolutionary War Insights
E N D
Presentation Transcript
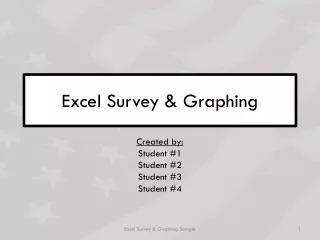
Excel Survey & Graphing Created by: Student #1 Student #2 Student #3 Student #4 Excel Survey & Graphing Sample
Student #1 Question: Who is your favorite Revolutionary War figure? Excel Survey & Graphing Sample
Student #2 Question: Which one of the original 13 colonies was the most important? Excel Survey & Graphing Sample
Student #3 Question: What is the most important event of the Revolutionary War? Excel Survey & Graphing Sample
Student #4 Question: What was the most important Revolutionary War document? Excel Survey & Graphing Sample
The Process • We took several online survey polls. • We brought in a survey with a graph and then we analyzed it. • We practiced graphing other charts we had made and learned about all the different types of graphs available. • We developed our own questions. • We made our own online survey and also a paper copy to record our votes we got from our classmates, friends, and family. • Next, we created a chart and then graphed the results. • The last step was to get together in groups of 4 and created this PowerPoint presentation. Excel Survey & Graphing Sample
Observations • Creating a questions was harder than we thought. • We know a lot of people – it was easy to find 50 people to take our survey. • Not every graph can work for every situation • There are many ways to customize a graph • It’s fun taking online surveys and it’s easy to transfer the information to Excel Excel Survey & Graphing Sample
Summary • Data can be collected in many ways • Graphs add to the understanding of charts • Graphs are a visual representation of data • Excel is an effective way to organize data Excel Survey & Graphing Sample