Download
1 / 20
200 likes | 222 Views
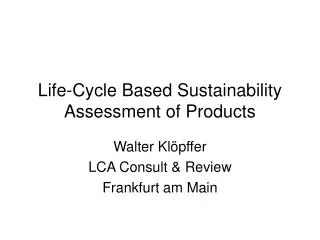
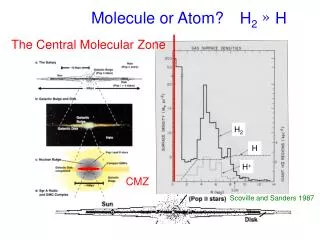
This study assesses and compares different hydrogen production pathways based on sustainability metrics. It covers global warming impacts, acidification potential, and human health impacts, with specific indicators for each stage. Conclusions highlight the successful use of sustainability metrics and areas for improvement.

E N D
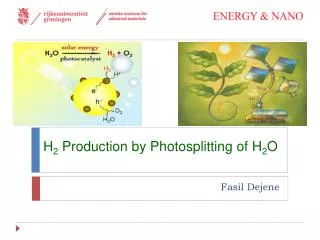
Sustainability Assessment of H2 Pathways Ben McLellan Chemical Engineering
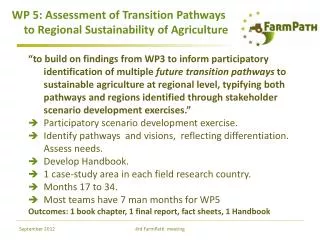
Introduction • Why Hydrogen? • Why Sustainability Metrics? • Purpose of this work
General Life Cycle Flowsheet Transport Transport / Storage Transport Extraction Production Purification Utilisation CO2 Capture Sequestration Transport
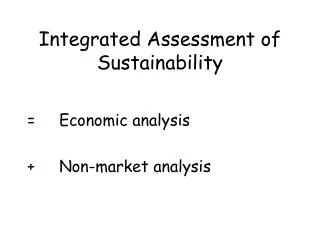
Sustainability Metrics Aim: to assess and compare the different pathways in terms of environmental sustainability Potential Environmental Impacts • Not location-specific (IChemE, TRACI) EB = Environmental burden WN = Mass of emission WH2 = GJ Hydrogen Produced PF = Potency Factor PEI = Potential Environmental Impact
Sustainability Metrics Specific Sustainability Metrics • Take location-specific factors into account SEI = Specific Environmental Impact SEB = Specific Environmental Burden K = unitless location-specific coefficient
Case Study • Two Source Extraction Points – one for NG, one for Coal • Options of on-site hydrogen production or at point of usage hydrogen production • Comparison of Source Transport, Source Extraction and Hydrogen Production Impacts
Feedstock Coal Coal NG NG Process Gasification (IGCC) Gasification (IGCC) Steam Reforming Steam Reforming Location #1 #2 #3 #4 Distance from Source Onsite (3km) 200km Onsite (3km) 450km Transport Type Rail Rail Pipeline Pipeline Mean Annual Days of Rain 92 66 95 53 Average soil pH 5.8 7.3 5.7 6.4 Population within 20km 1075 274955 812 5749 Case Study - Details Table 1: Hypothetical Test Case Data
Global Warming Impacts • CO2 and hydrocarbon emissions from each stage given as CO2 equivalence • K value based directly on emissions
Acidification Potential • NOx and SOx emissions weighted in terms of SO2 equivalence • PEI from simple addition of emissions (factor of 0.7 for NOx) • K value based on annual rainfall and soil pH in the region Rain factor: Where frain is the mean annual days of rain. Soil factor: (pH >0)
Human Health Impacts • Mainly from H2 Production – only emissions assessed here • Particulates • Assumed to have a major impact only in the surrounding 20km radius • K value based on population in surrounding area
Situation Extraction Transport Production # 1 0.22 5.05E-07 34.54 # 2 0.22 3.50E-03 34.54 # 3 2.59E-03 4.45E-07 22.05 # 4 2.59E-03 8.80E-03 22.05 Global Warming Potential - Comparison of Stages Global Warming Specific Environmental Impacts (kg CO2-eq / GJ H2)
Ranking changes with SEI due to different soil pH / rainfall conditions Ranking changes with SEI due to local population As expected because Global Warming is non-location-specific Summary of Results Ranking of Overall Environmental Impacts (1- Highest, 4- Lowest)
Conclusions • Sustainability metrics were used successfully • Some adjustments need to be made to enable more wide-ranging use (inclusion of social/economic factors, distance/time variable models) • The data and model require refining • The importance of specific indicators demonstrated
Conclusions • Sustainability Metrics can be used to compare different technology impacts, different life cycle stages and different locations • A useful tool, but the process needs to be improved so that it is more scientific
Global Warming Acidification Human Health Situation PEI SEI PEI SEI PEI SEI #1 34.54 34.54 0.0291 0.027 0.1925 0.0008 #2 34.54 34.54 0.0291 0 0.1925 0.1925 #3 22.05 14.07 0.0075 0.0075 0.064 0.0002 #4 22.05 14.07 0.0075 0.0039 0.064 0.001 Hydrogen Production – Summary of Results
Global Warming Situation PEI SEI #1 7.62 7.62 #2 7.62 7.62 #3 0.239 0.0075 #4 0.239 0.0075 Global Warming Acidification Situation PEI SEI PEI SEI #1 0.0042 3.96E-05 8.18E-08 7.47E-08 #2 0.35 0.27 6.82E-06 0 #3 0.0031 2.23E-05 5.25E-11 5.25E-11 #4 0.44 0.44 7.89E-09 4.11E-09 Transport and Extraction – Summary of Results Transport Impacts Extraction Impacts