Download

1 / 11
110 likes | 140 Views
Practice determining linear relationships and correlations using scatterplots. Identify positive and negative correlations between variables x and y with visual representations.

E N D
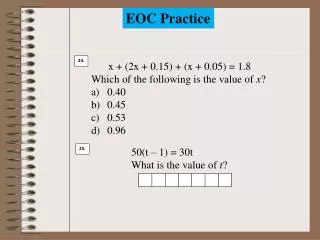
EOC Practice #27 SPI 3102.5.3
EOC Practice #27 • Using a scatterplot, determine if a linear relationship exists and describe the association between variables.
Which scatterplot best represents a positive linear relationship between the variables x and y? A B C D
2. What type of correlation is shown in the scatterplot below? • Positive correlation • Negative correlation • No correlation • D. Random correlation
3. Which graph best shows a negative linear relationship between variables x and y? A B C D
4. What type of correlation is shown in the scatterplot below? • Positive correlation • Negative correlation • No correlation • D. Random correlation