Download
1 / 4
50 likes | 246 Views
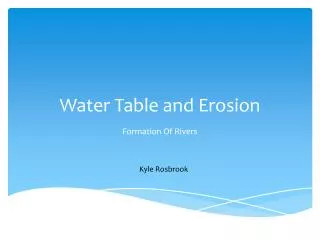
Soil Surface. Water Table. Soil Surface. Soil Surface. Soil Surface. Water Table. Soil Surface. Water Table. Water Table. Water Table. Water Table Heterogeneity. Many studies assume uniform water table distribution within static, prescribed wetland area

E N D
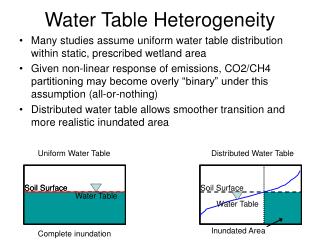
Soil Surface Water Table Soil Surface Soil Surface Soil Surface Water Table Soil Surface Water Table Water Table Water Table Water Table Heterogeneity • Many studies assume uniform water table distribution within static, prescribed wetland area • Given non-linear response of emissions, CO2/CH4 partitioning may become overly “binary” under this assumption (all-or-nothing) • Distributed water table allows smoother transition and more realistic inundated area Uniform Water Table Distributed Water Table Inundated Area Complete inundation No inundation
How do resulting emissions differ between uniform water table and distributed water table? Experiment: • Calibrate methane model to match in situ emissions at a point (Bakchar site, Friborg et al, 2003) • Distributed case: calibrate distributed model water table depth to match observed inundation CH4 • Uniform case: select water table timeseries from single point in the landscape having same long-term average methane emissions as the entire grid cell in the distributed case; apply this water table to entire grid cell Water Table Inundated Area (matching remote sensing)
Interannual Variability, 1948-2007 Possible trend in temperature, also in CH4 Uniform Water Table: Shallower than average of distributed case But never reaches surface; no inundation Resulting CH4 has higher variability than for distributed case Distributed case is buffered by high- and low-emitting regions Impact on trends? Distrib Water Table Uniform Water Table
Net Greenhouse Warming Potential • CH4 makes up small part of C budget, but large contribution to greenhouse warming potential • On 100-year timescale, GHWP(CH4) = approx. 23 * GHWP(CO2) NPP and RhCO2 approximately cancel Net GHWP essentially follows GHWP(CH4) • Uniform water table: • CH4 has larger interannual variability • So does net GHWP • Impact on trend assessment? NPP RhCO2 - NPP RhCO2 NET GHWP RhCH4