Risk Matrix Analysis: Prioritizing Risks Effectively
190 likes | 234 Views
Learn how to use a risk matrix to assess and prioritize risks based on likelihood and consequence, enhancing risk management strategies in your projects or business.

Risk Matrix Analysis: Prioritizing Risks Effectively
E N D
Presentation Transcript
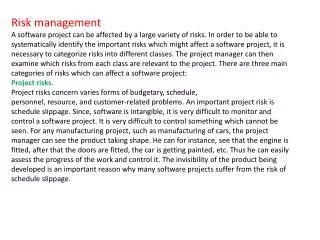
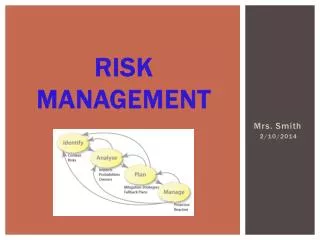
Risk Management ANALYZE - RISK MATRIX
Analyze – Risk Matrix • 風險矩陣[1][2][3]是定性分析 • One widely used method of prioritizing risks is through the use of risk scoring matrices that quantify the likelihood and consequence of occurrence. • Likelihood is the probability that an identified risk event will occur. • Consequence is an assessment of the worst credible potential result(s) of a risk. • The risk’s likelihood and consequence are scored using ordinal scales from one to five.
Risk Matrix-ConsequenceScales • First, the high end of the scale must accurately represent a dire circumstance, such as absolute mission failure. • Second, the five levels must be clearly defined to easily score the risk. • Third, the corresponding levels among the critical success factors must be equivalent.
風險狀態 • 減輕中 → 風險暴露值 ≧ 臨界M。 • 觀察中 → 臨界M >風險暴露值 ≧ 臨界A。 • 可接受 → 風險暴露值 <臨界A。 • 舉例來說:設定臨界M=(4)高,臨界A=(2)低: 當嚴重度為高或非常高(紅色區域)就須執行風險減輕(Mitigation)計畫直到風險嚴重度降到黃色區域為止,嚴重度在黃色區域的風險視需要也可考慮執行風險減輕計畫或規劃替代方案,嚴重度在綠色區域的風險就可適度延長再評估週期或考慮結束風險。
風險矩陣簡化圖 風險暴露值 (RiskExposure) [三個等級] 可能性 [五個等級] 後果 [五個等級] = *
風險矩陣 – 實例 • 建立風險管理策略,定義風險參數如下表:
風險矩陣 – 實例 • 定義風險再評估週期:
風險矩陣 – 實例 • 風險識別:每個人都可以提出自己感知到的風險,交由專家做篩選。 • 例如:程式開發,可能缺乏熟悉C++的程式設計師,預估系統需要延遲30天完成。
風險矩陣 – 實例 • 風險分析:風險描述為因缺乏熟悉C++程式設計師,預估系統需延遲30天完成。參考風險管理策略所定義的風險參數後,除了可能性、成本及時程三個必要參數外,因客戶對系統效能有特定要求,決定使用效能這個參數,經評估風險參數後,對每個參數訂出嚴重度,因為與估計時程會延後30天,所以將時程的嚴重度定為(5)Very High;
風險矩陣 – 實例 • 成本的嚴重度: (1)VeryLow • 時程的嚴重度: (5)Very High • 效能的嚴重度: (1)VeryLow • 可能性的嚴重度: (3)Moderate • 所以,後果(Consequence)嚴重度為(5)Very High • 風險為紅色狀態,需執行風險減輕或應變計畫
風險矩陣 – 實例 • 規劃風險減輕及緊急應變計畫 • 例如: (1)與客戶協調改用其他程式語言 (2)聘用熟悉且有經驗的C++程式設計師
風險矩陣的缺點 • 這個方法其中存在某些問題,在判斷”後果”嚴重度時,是取所有子項中嚴重度最高者來代表後果的嚴重度而忽略其他子項嚴重度的高低,這種判斷方式會有很嚴重的問題。
風險矩陣的缺點 • 專案一及專案二的後果嚴重度都是5,但是每個人都可以很輕易看出風險發生時專案2的後果嚴重程度一定比專案1高,但是以現存的方法來評估,假設兩專案風險之發生率也是一樣高,則算出來的風險暴露值也是一樣的嚴重度,在我們要判斷風險相對的嚴重度時就會發生問題,無法正確判斷出嚴重度最高的風險,反映實際的狀況。
參考文獻 • [1] L Fussell, S Field, The Role of the Risk Management Database in the RiskManagement Process, Systems Engineering, 2005. ICSEng 2005. 18thInternational , 2005 • [2] Jeevan Perera, PhD, JD, Jerry Holsomback, An Integrated Risk ManagementTool and Process, Aerospace, 2005 IEEE Conference 5-12 March 2005Page(s):129 – 136 • [3]陳景新,設計與實作使用模糊風險分析和控制方法之服務導向風險管理系統, 碩士論文