Download
1 / 66
690 likes | 864 Views
Impacts of Aerosols on Clouds and Climate.

E N D
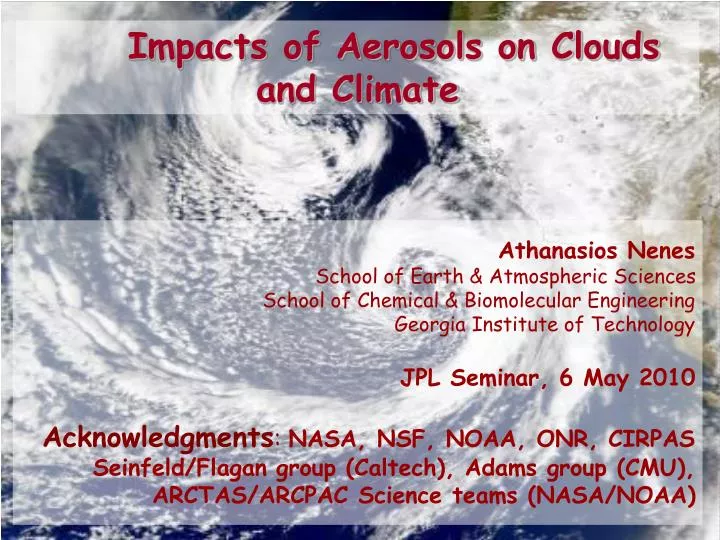
Impacts of Aerosols on Clouds and Climate Athanasios NenesSchool of Earth & Atmospheric SciencesSchool of Chemical & Biomolecular EngineeringGeorgia Institute of TechnologyJPL Seminar, 6 May 2010Acknowledgments: NASA, NSF, NOAA, ONR, CIRPASSeinfeld/Flagan group (Caltech), Adams group (CMU), ARCTAS/ARCPAC Science teams (NASA/NOAA)
How do (liquid water) clouds form? Clouds form in regions of the atmosphere where there is too much water vapor (it is “supersaturated”). This happens when air is cooled (primarily through expansion in updraft regions and radiative cooling). Cloud droplets nucleate on pre-existing particles found in the atmosphere (aerosols). This process is known as activation. Aerosols that can become droplets are called cloud condensation nuclei (CCN). Cloud CCN that activates into a cloud drop Aerosol particle that does not activate
Lower A l bedo Higher A l bedo CCN Clean Environment CCN (few CCN) Polluted Environment (more CCN) Humans can affect clouds and the hydrological cycle By changing global CCN concentrations (air pollution). Polluted clouds are “whiter”, change in precipitation efficiency. This yields a net cooling on climate and is called the “indirect climatic effect of aerosols”. Increasing particles tends to cool climate (potentially alot). Quantitative assessments done with climate models.
Observational evidence of indirect effect Satellite observation of clouds in the Black Sea. Red: Clouds with low reflectivity. White: Clouds that reflect alot. Blue: Clear sky. Rosenfeld et al., Science
Observational evidence of indirect effect Air pollution can affect cloud properties Satellite observation of clouds in the Black Sea. Power plant Lead smelter Wind direction Port Oil refineries Red: Clouds with low reflectivity. White: Clouds that reflect alot. Blue: Clear sky. Rosenfeld et al., Science
Quantification of the Indirect Effect in Climate Models Aerosol Size Distribution and Chemical Composition Cloud Radiative Properties, changes in precipitation Cloud Droplet Number and Size This problem largely depends on the relationship between aerosol number concentration and cloud droplet number concentration. Empirical relationships are often used.
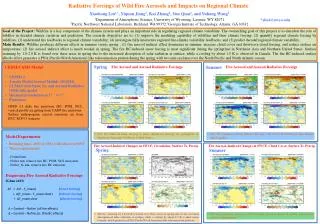
Aerosol Indirect Radiative Forcing (W m-2) Global Annual Average North America pollution plumes Long-range transport European and Asian pollution plumes Biomass burning Sotiropoulou et al., 2007 Spatial pattern of IF follows that of aerosol variations
3 3 grid climateprediction.net Problems with GCM assessments of aerosol indirect effect • Cloud formation happens at smaller spatial scales than global climate models can resolve. • Aerosol-cloud interactions are complex. • Climate models provide limited information about clouds and aerosols. • Describing cloud formation explicitly in global models is VERY expensive. These calculations need to be simplified (“parameterized”).
(Boucher & Lohmann, 1995) Droplet Concentration Increasingly polluted Aerosol sulfate concentration (proxy for pollution) Approach for aerosol-Nd : empirical • Large variability. • Why? • Unaccounted: • Meteorology • Cloud microphysics • Composition • etc… Many studies still utilize this type of approach. Large predictive uncertainty, without “chances” of improving.
collision/coalescence drop growth activation aerosol Current Direction: Use simplified but physically based approaches for cloud processes Dynamics Updraft Velocity Large Scale Thermodynamics Particle characteristics Size Concentration Chemical Composition Cloud Processes Cloud droplet formation Drizzle formation Rainwater formation Chemistry inside cloud droplets Links/feedbacks need to be incorporated (in some way). VERY challenging problem (Feingold and Stevens, 2009)
So… when does an aerosol particle act as a CCN ? Start from a pure H2O drop 102 As the droplet size decreases, its equilibrium vapor pressure increases (Kelvin effect). Less molecules around in small drops to “pull” H2O in the droplet phase Kelvin 101 Relative Humidity (%) 100 99 98 0.1 1 10 Wet diameter (mm)
Solute Concentration (M) 10 1 0.1 102 Kelvin 101 Relative Humidity (%) 100 Raoult’s Law applied to (NH4)2SO4 particle with 20 nm dry diameter 99 98 0.1 1 10 Wet aerosol diameter (mm) When does an aerosol particle act as a CCN ? Take same drop and add some solute; e.g., (NH4)2SO4 Dissolved material decreases vapor pressure (Raoult effect). As particle grows, this effect is less important
Solute Concentration (M) 10 1 0.1 102 The combined Kelvin and Raoult effects is known as the Köhler equation. You can be in equilibrium even if you are above saturation. Kelvin Kelvin+Raoult (Köhler) 101 Relative Humidity (%) 100 Raoult for (NH4)2SO4 20 nm dry diameter 99 98 0.1 1 10 Wet aerosol diameter (mm) When does an aerosol particle act as a CCN ? Put both effects together: You get the equilibrium vapor pressure of a wet aerosol particle.
Critical Sc Critical Wet Diameter, Dc Wet Aerosol (Haze) Cloud Droplet When does an aerosol particle act as a CCN ? Dynamical behavior of an aerosol particle in a variable RH environment. 102 101 Relative Humidity (%) 100 99 98 0.1 1 10 Wet aerosol diameter (mm) When ambient saturation ratio exceeds Sc, particles act as CCN. CCN = f (Size, Chemical Composition)
1:1 dN/dlogdp [cm-3] [CCN]predicted dp ,nm [CCN]measured Testing CCN activation theory: CCN “Closure” studies Compare measurements of CCN to predictions using Köhleractivation theory. CCN Closure Aerosol Size Distribution integrate [CCN]predicted Use theory to predict the particlesthat can act as CCN based on measured chemical composition and CCN instrument supersaturation.
Finokalia Aerosol Measurement Campaign (FAME-07) – Summer 2007 Finokalia DMT CCN counter Supersaturation range: 0.2-1.0% TSI 3080 SMPS Size range: 20-460 nm Low-vol impactor Ionic composition measured via IC WSOC/EC/OC also measured (Bougiatioti et al., ACP, 2009)
Finokalia Aerosol Measurement Campaign (FAME-07) – CCN closure 2% overprediction (on average). Introducing compreshensive composition into CCN calculation gives excellent CCN closure. Köhler (CCN activation) theory really works. (Bougiatioti et al., ACP, 2009)
t Smax drop growth activation S aerosol CCN activation requires knowledge of cloud RH… Approach: use the “simple story of droplet formation” Basic ideas: Solve conservation laws for energy and the water vapor condensing on aerosol particles in cloudy updrafts. • Steps are: • Air parcel cools • Eventually exceeds dew point • Water vapor is supersaturated • Droplets start forming on • existing CCN. • Condensation of water • on droplets becomes intense. • S reaches a maximum • No more droplets form A “classical” nucleation/growth problem
“Mechanistic” Cloud Parameterizations efficiently solve drop/ice formation problem Input: P,T, vertical wind, particle size distribution,composition. Output: Cloud properties (droplet number, size distribution). How: Solve one algebraic equation (instead of ODE’s). Examples for liquid clouds: Abdul-Razzak et al., (2000); Nenes and Seinfeld (2003), Fountoukis and Nenes (2005), Ming et al., (2007); Barahona and Nenes (2007) Examples for ice clouds: Liu and Penner (2005); Barahona and Nenes (2008, 2009ab) Kärcher and Lohmann (2001) • Characteristics: • 103-106 times faster than numerical cloud models. • Impressive agreement with numerical models.
CIRPAS Twin Otter NOAA P3 Are these parameterizations “good enough”? Apply them to real clouds. In-situ data obtained from airborne platforms is ideal for this purpose!
Parameterization EvaluationCDNC “closure” Observed Aerosol size distribution Observed Cloud updraft Velocity Observed Aerosol composition Parameterization Observed Cloud Droplet Number Predicted Cloud droplet number Compare
CRYSTAL-FACE (2002) Cumulus clouds CIRPAS Twin Otter Parameterization agrees with observed CDNC Agreement to within a few % (on average) ! Meskhidze et al.,JGR (2005)
CRYSTAL-FACE (2002) Cumulus clouds CIRPAS Twin Otter Parameterization agrees with observed CDNC Agreement to within a few % (on average) ! Great agreement… …when you know the input. Meskhidze et al.,JGR (2005)
Organic species are a headache • They can facilitate cloud formation by acting as surfactants and adding solute (hygroscopicity) • Oily films can form and delay cloud growth kinetics Aerosol Problem: Complexity An integrated “soup” of Inorganics, organics (1000’s) Particles can have uniform composition with size… … or not Can vary vastly with space and time (esp. near sources) In-situ data to study the aerosol-CCN link: Usage of CCN activity measurements to “constrain” the above “chemical effects” on cloud droplet formation.
Understanding & parameterizing CCN activity… Organics and inorganics add solute and can be expressed in terms of a “hygroscopicity parameter”, k (Petters and Kreidenweis, 2007) k = org korg + inorg kinorg kinorg ~ 0.6 for(NH4)2SO4 to 0.9 for NaCl korg ~ 0.0-0.3 and depends on oxidation state and precursor. If organics are composed of a “soluble” and an “insoluble” fraction, then korg = sol ksol + insolkinsol ~ sol ksol 0 See how the k of water-soluble organics vary in samples
Determining k: size-resolved CCN measurements Size Selection Aerosol Generation Polydisperse Aerosol Shaker, Atomizer, or ambient sample Scanning Mobility Particle Sizer Monodisperse Aerosol Condensation Particle Counter, 3010 Particle Detection Count CCN Continuous Flow Streamwise Thermal Gradient Counter Count CN
Aerosol Generation Polydisperse Aerosol Activated CCN Fraction CN Burrell Wrist Action Shaker = Determining k: size-resolved CCN measurements Size Selection Results: “activation curves” CCN/CN as a function of d Scanning Mobility Particle Sizer Monodisperse Aerosol Activated Fraction of particles (CCN/CN) Condensation Particle Counter, 3010 Mobility Diameter (nm) Particle Detection Count CCN Continuous Flow Streamwise Thermal Gradient Counter Count CN
Aerosol Generation d50 : aerosol becomes more hygroscopic Polydisperse Aerosol Burrell Wrist Action Shaker Determining k: size-resolved CCN measurements Size Selection d50 : diameter for which 50 % of the particles activateinto cloud droplets. Scanning Mobility Particle Sizer Monodisperse Aerosol Activated Fraction of particles (CCN/CN) Condensation Particle Counter, 3010 Mobility Diameter (nm) Particle Detection Count CCN Continuous Flow Streamwise Thermal Gradient Counter Count CN
Parameterizing the CCN activity data using methods based on Köhler-theory • Determine d50 dependence on supersaturation. • Fit the measurements to a power law expression. • Relate fitted coefficients to aerosol properties (e.g. hygroscopicity parameter k) by applying theory: (NH4)2SO4 (NH4)2SO4 … but k is a normalized average molecular weight of the solute in the aerosol and can be used to infer its nature. Petters and Kreidenweis, ACP (2007); Padró et al., ACP (2007)
from experimental data Inferring molar volume (molecular weight) For a particle containing only water-soluble organics: so Average molecular weight over density (molar volume) Constants This is Köhler Theory Analysis (Padró et al., ACP, 2007)
Major findings on water-soluble organics Many “aged” soluble organics (SOA) from a wide variety of sources have a remarkably similar hygroscopicity. Aged organics in Mexico City aerosol from MILAGRO (Padró et al, in press). ksol = 0.28 ± 0.06, regardless of location and time ! Molar volume/surfactant (KTA) analysis suggests that: Daytime samples contain organics ~200 amu on average and depress surface tension a few % Nighttime samples contain organics ~400 amu on average and depress surface tension 10-15 % Changes in surface tension partially compensates for shifts in average molar volume to give the constant ksol
Major findings on water-soluble organics Data from SOA chamber experiments Organic Aerosol from biogenic VOC emissions a-pinene, monoterpene oxidation (Engelhart et al., ACP, 2009). ksol ~ 0.28 b-caryophyllene (Asa-Awuku et al., ACP, 2009). ksol ~ 0.26 KTA suggests that: both systems contain organics ~200 amu on average and depress surface tension a few % Anthropogenic VOCs (Asa-Awuku et al.,ACP, 2010) terpinolene, cycloheptene, 1-methylcycloheptene ozonolysis ksol ~ 0.26-0.33
Major findings on water-soluble organics Even biomass-burning aerosol exhibits similar properties: Aerosol samples from prescribed fire burning (Sullivan et al., 2006) ksol ~ 0.33 (Asa-Awuku et al., 2008) Speciation across samples varies considerably, but their cumulative effects on CCN activity are about the same. Changes in surface tension partially compensates for shifts in average molar volume to give the constant ksol What matters is the fraction of soluble organic… Complexity sometimes simplifies things for us. korg = (0.25±0.05) esol
Test organic parameterization on Arctic CCN NOAA ARCPAC: Aerosol Radiation and Cloud Processes affecting Arctic Climate NASA ARCTAS: Arctic Research of the Composition of the Troposphere from Aircraft and Satellites Date: April, June, July 2008. Platforms: NASA WB-P3, DC-8 Arctic haze / pollution; Boreal Forest Fires Date: April, 2008. Platform: NOAA WB-P3 Arctic haze / pollution; Flights over ice / leads Map of all Alaskan flights during the ARCPAC campaign. Flight tracks for the ARCTAS-B summer deployment. Jacob et al, ACP, 2009
CCN In Fresh Biomass Burning Plumes: neglecting organics • Closure Inputs: • AMS bulk chemistry • SS: 0.3 - 0.6% • Surface Tension of Water Closure Error Histogram Large under-prediction for biomass burning! • Tendency towards under-prediction. • WSOC and AMS data suggest 30-60% of organics in fires are water-soluble. Lathem et al., manuscript in preparation
Before (# 1) After (# 2) CCN In Fresh Biomass Burning Plumes: including organics Large under-prediction is now gone! • • Explicitly include organic impacts on CCN activity as korg = WSOC * 0.25 • •Most of the CCN prediction bias can be accounted for with a simple rule. • The remaining scatter can be attributed (mostly) to size-dependent composition.
Some “take-home” messages CCN theory is adequate for describing cloud droplet formation. Physically based formulations for description of cloud droplet formation in GCMs are comprehensive… but are still computationally feasible. Size-resolved measurements of CCN activity are very useful for constraining the extent and sources of aerosol hygroscopicity on cloud droplet formation. The water-soluble fraction of oxidized organics is very hygroscopic, and is surprisingly constant. The cumulative effect of organics on CCN activity can likely be described by a simple relationship of the form: korg = (0.25±0.05) esol
Cirrus (Ice) Cloud Parameterization Ice Crystal Population Multiplemechanisms for ice formation can be active. http://www.alanbauer.com Heterogeneous Freezing (Immersion, deposition, contact, …) Also depends on the material and surface area Homogeneous Freezing Mainly depends on RHiand T Wet aerosol particles + Insoluble Material (“Ice Nuclei”)
Conceptual Model of Ice Formation in Cirrus Homogeneous freezing of droplets Crystal growth, fresh IN continue to freeze and deplete vapor Heterogeneous IN freezing begin forming ice Expansion cooling and ice supersaturation development Soluble and insoluble aerosol initial distribution Height (km) Ice Crystals 10 9.5 9 8.5 8 Homogeneous V Heterogeneous Liquid droplets + Insoluble material 100 110 120 130 140 150 160 RHi (%)
The Effect of IN on Ice Crystal Number Concentration Homogeneous and Heterogeneous Heterogeneous Homogeneous Ice Crystal Concentration (cm-3) Nc=Nlim Ice Nuclei Concentration (cm-3) Barahona and Nenes, ACP, 2009a.
Parameterization DevelopmentPart 1: Pure Homogeneous Freezing Parcel Ice Saturation • Define freezing probability as a function of T and P • Link the freezing probability to crystal size and concentration • Solve for crystal concentration at the maximum RHi Ice Crystal So’ growth freezing time Barahona and Nenes, JGR, 2008
Parameterization Development Part 1: Pure Homogeneous Freezing (Crystal population balance) Find a Solution of:
Parameterization Development Part 1: Pure Homogeneous Freezing (Crystal population balance) Find a Solution of:
Parameterization Development Part 1: Pure Homogeneous Freezing (Crystal population balance) Find a Solution of: Calculate freezing probability:
Parameterization Development Part 1: Pure Homogeneous Freezing (Crystal population balance) Find a Solution of: Calculate freezing probability: Calculate size distribution:
Parameterization Development Part 1: Pure Homogeneous Freezing (Crystal population balance) Find a Solution of: Calculate freezing probability: Calculate size distribution: Solve supersaturation balance:
Parameterization Development Part 1: Pure Homogeneous Freezing (Crystal population balance) Find a Solution of: LOTS AND LOTS OF MATH (and scaling) … Calculate freezing probability: Calculate size distribution: Solve supersaturation balance:
Parameterization Development Part 1: Pure Homogeneous Freezing The solution of the PDE system reduces to: ≡ f (aerosol size and concentration, P and T ) Homogeneously Frozen Fraction Aerosol Number Concentration Ice Crystal Number Concentration A few lines of FORTRAN code. It is completely theoretical (i.e. rigorous and robust) and captures the (complex) physics of ice nucleation. We can also calculate the size distribution… (not shown) Barahona and Nenes, JGR, 2008
Parameterization DevelopmentPart 2: Including Effects of IN Height Ice Crystals • IN tend to freeze early, grow and deplete water vapor • Can inhibit homogeneous nucleation • IN also contribute to the total ice crystal concentration RHi Homogeneous V Crystal Growth Heterogeneous Liquid droplets + insoluble material Homogeneous (%) 100 110 120 130 140 150 Heterogeneous
Parameterization DevelopmentPart 2: Including Effects of IN Energy balance Global water vapor balance Ice water vapor condensation Ice crystal size distribution evolution = nucleation + growth … even more math and scaling… Ice crystal growth Barahona and Nenes, JGR, 2008; ACP, 2009a