Download

1 / 10
0 likes | 8 Views
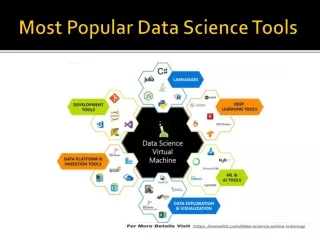
In this presentation, we will explore the most popular tools that data scientists rely on to derive meaningful insights across industries.

E N D