Download
1 / 8
80 likes | 196 Views
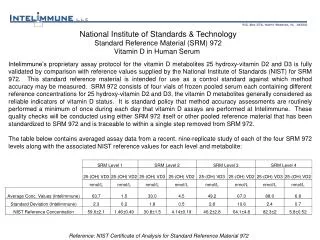
Reference Material. 9 June 2008. 1. The World’s CO2 Emissions (Current Trends). The World’s CO2 Emissions from Fuel Combustion. (2005). (1990). Countries that have quantified emission reduction commitments under the Kyoto Protocol. Countries that do NOT have quantified emission

E N D
Reference Material 9 June 2008 1
The World’s CO2 Emissions (Current Trends) The World’s CO2 Emissions from Fuel Combustion (2005) (1990) Countries that have quantified emission reduction commitments under the Kyoto Protocol Countries that do NOT have quantified emission reduction commitments under the Kyoto Protocol ※Categorization of countries is based upon the status quo in terms of Kyoto Protocol Source:International Energy Agency(IEA)
The World’s CO2 Emissions (Estimate) 60,000 50,000 62% Other Developing Countries 40,000 Brazil (million tons CO2) India 30,000 52% China 48% 20,000 34% 18% USA 23% 23% 21% 10,000 Annex I countries excluding USA 25% 21% 43% 31% 0 1990 2000 2005 2010 2015 2020 2025 2030 2035 2040 2045 2050 Source: Research Institute of Innovative Technology for the Earth (RITE) 3
Mid-term Strategy and Long-term Strategy Future Estimate (BAU case) <Long-term Strategy> <Mid-term Strategy> Global CO2 Emissions “Innovation” ・develop innovative technologies ・shift to a low-carbon society “Post-Kyoto Framework” ・bring global emissions to peak within the next 10 to 20 years Cut global emissions by half by 2050 • “International Environment Cooperation” • accelerate improvement of • global energy efficiency • new financial mechanism • (Cool Earth Partnership) 2050 2018~2028 Present 4
Japan’s Energy Efficiency Continues to Improve Energy consumption by Japanese Industries has remained constant while GDP has doubled Trends in Energy Consumption in the Industrial Sector and Real GDP 500 600 450 500 400 Real GDP 350 400 Total Energy Consumption in the Industrial Sector 300 Real GDP (trillions of yen) Total Energy Consumption (1 million kilo liters of crude oil equivalent) 250 300 200 200 150 100 100 50 0 0 1973 1975 1977 1979 1981 1983 1985 1987 1989 1991 1993 1995 1997 1999 2001 2003 Source: “Energy Balances in Japan,” Agency for Natural Energy Resources of the government of Japan “System of National Accounts,” Cabinet Office of the government of Japan 5
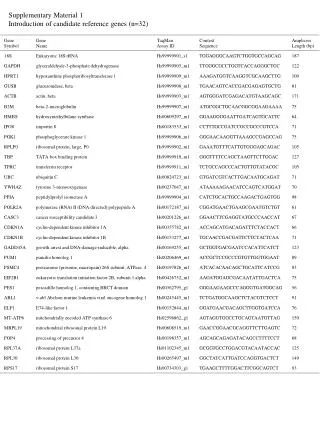
Government Investment Levels in Research and Development in Energy-related Areas Global Trend in Public Investment in Research and Development in the Energy Sector Trend in Public Investment in Research and Development in the Energy Sector by Country (2005) (Unit: US$ million) (Unit: US$ million) Steep decrease 129.9 UK Increase required 320.5 Italy 513.2 Germany France 523.4 Japan leads the world USA 3017.8 Japan 3905.3 0 1000 2000 3000 4000 5000 Source: IEA ; European Commission Source: IEA 6
Source: United Nations Framework Convention on Climate Change (UNFCCC) Trends in Greenhouse Gas Emissions by Major Economies (Unit: million tons CO2e) *CO2e=carbon dioxide-equivalent 7
USA Japan Source: IEA Trends in Energy Efficiency Levels of Major Economies {Unit: Energy Consumption (crude oil tons equiv.)/GDP(1,000 USD)} 8