Download

1 / 38
380 likes | 557 Views
Pedestrian Safety At Intersections. Assessment of the Walking Security Index - WSI. Safety and Traffic Services – 5 February 2003. Presentation Overview. Background Purposes of WSI WSI Formulations WSI Report – July 1998 WSI Refinements Staff Concerns Technical Review

E N D
Pedestrian Safety At Intersections Assessment of the Walking Security Index - WSI Safety and Traffic Services – 5 February 2003
Presentation Overview • Background • Purposes of WSI • WSI Formulations • WSI Report – July 1998 • WSI Refinements • Staff Concerns • Technical Review • Vulnerable Road Users Safety & Traffic Services
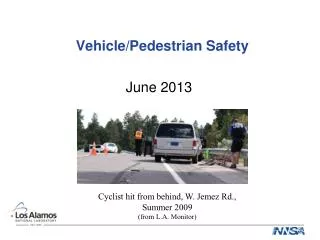
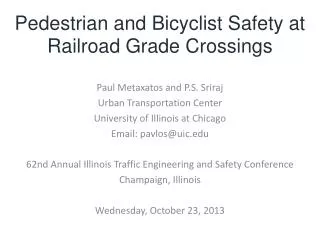
Background • Spawned by public concern for pedestrian safety at • right-turn cut-off ramps at signalized intersections • At most of these intersections few, if any, collisions • involving pedestrians had been reported; nonetheless, • complaints persisted in response to “close calls” • Resulted in “A Survey of Pedestrian Concerns and Attitudes at Right-turn Cut-offs” at Laurier/Nicholas by Professor Barry Wellar and his students as a class project in 1994-95 • Results were inconclusive Safety & Traffic Services
Background • WSI concept was formulated by Professor Wellar • and evolved as a “spin off” project from the • Laurier / Nicholas “cut-off ramp” Study • WSI purpose set out in a 1995 TEAP Project was: • “To define an index to objectively measure • pedestrian security at intersections including • comfort and convenience as well as safety • components” Safety & Traffic Services
What are the purposes of WSI? • To provide a means of better describing the walking • security experience of pedestrians at signalized • intersections; • To provide a means of better explaining why • pedestrians’ experiences differ from their • expectations in regard to security; Source: Walking Security Index Report (p 32) – Wellar, July 1998 Safety & Traffic Services
Purposes of WSI • To provide a means of better predicting the • consequences for pedestrians’ security that are likely • to occur as a result of intersection infrastructure • modifications and/or changes in the behaviors of • users; and, • To provide a means of better evaluating the • consequences for pedestrians’ security that are likely • to arise from proposed modifications to signalized • intersections, infrastructures, and/or to the • behaviors of intersection users. Source: Walking Security Index Report (p 32) – Wellar, July 1998 Safety & Traffic Services
WSI Formulations: • Vehicle-Pedestrian Interaction Potential (V-PIP) Index V-PIP = # of vehicles/hr x # pedestrians/hr…(1) Source: Walking Security Index Report – Wellar, July 1998 Safety & Traffic Services
WSI Formulations: • Vehicle-Pedestrian Interaction Potential (V-PIP) • Index • V-PIP = # of vehicles/hr x # pedestrians/hr…(1) • Weighted Vehicle-Pedestrian Interaction • Potential (WV-PIP) Index • WV-PIP = # of vehicles²/hr x # of pedestrians/hr …(2) Source: Walking Security Index Report – Wellar, July 1998 Safety & Traffic Services
WSI Formulations • Weighted Passenger Car Equivalent-Pedestrian • Interaction Potential (WPCE-PIP) Index WPCE-PIP = # of passenger car equivalents²/hr x # of pedestrians/hr …(3) Where: automobile = 1.0 passenger car equivalent; heavy vehicle = 1.7 passenger car equivalent; and, bus = 1.7 passenger car equivalent. Source: Walking Security Index Report (p 41 - 47) – Wellar, July 1998 Safety & Traffic Services
WSI Formulations 4. Quality of Infrastructure Condition (QIC) Index 18 variables pertaining to intersection construction or maintenance features…(4) • It’spurpose is to provide an assessment of whether • intersection features involving infrastructure • construction and maintenance meet pedestrians’ • security expectations. Source: Walking Security Index Report (p 47, 48) – Wellar, July 1998 Safety & Traffic Services
QICI Field Form Safety & Traffic Services
WSI Formulations • Intersection Pedestrian Challenge-Features • (IPC-F) Index IPC-F = NLR x NTLTR x IGR x ISR x DTFR x NCR …(5) Where: NLR = number of lanes rating NTLTR = number of lanes by type rating IGR = intersection geometry rating ISR = intersection slope rating DTFR = direction(s) of traffic flow rating NCR = number of channels adjacent to intersection rating Source: Walking Security Index Report (p 50 - 68) – Wellar, July 1998 Safety & Traffic Services
WSI Formulations 6. Basic Walking Security (BWS) Index BWS = (WPCE–PIP) x (IPC-F) …(6) Where: BWS =a composite index score that ranks signalized intersections according to the likelihood that pedestrians’ security expectations are matched by experiences. WPCE–PIP = an index score that represents the quality of potential interactions between pedestrians or vehicles (expressed as passenger car units) at signalized intersections. IPC-F = an index score that represents the magnitude of challenge to pedestrians’ security caused by intersections’ features. Source: Walking Security Index Report (p 50 - 70) – Wellar, July 1998 Safety & Traffic Services
WSI Formulations Aggressive Driving Indexes: (AD_) (ADR) Index: Red = # of vehicles through on red/hr total # of vehicles/hr …(7) (ADA) Index: Amber = # of vehicles through on amber/hr total # of vehicles/hr …(8) (ADRA) Index: Red + Amber = # of vehicles through (red+amber)/hr total # of vehicles/hr …(9) Source: Walking Security Index Report (p 75) – Wellar, July 1998 Safety & Traffic Services
WSI Formulations Aggressive Driving Fail-to-Yield (ADFY) Index (ADFY) Index = # of vehicles that fail to yield to pedestrians/hr total # of vehicles/hr …(10) The fail to yield index applies in all those crosswalk and channel situations where vehicle operators engage in behaviors that threaten pedestrians’ security: Source: Walking Security Index Report (p 77) – Wellar, July 1998 Safety & Traffic Services
Report on WSI - July 1998 • Study resulted in 17 Recommendations • Staff supported 11 – current policy or were technically supportable • Staff could not support the remaining • recommendations - some were contrary to Highway Traffic Act Safety & Traffic Services
Report on WSI – July 1998 • Following consideration of the WSI Report, the • researcher presented a proposal to Transportation Committee, asking that the Study be extended • Staff were not consulted beforehand • Committee and Council approved the proposal for a • pilot study that would provide a more robust sample • of field data to refine indexes and variables in WSI • Field testing was intended to confirm operationality, not utility • Resulted in 6 Technical Reports and Final Pilot • Study Report received in May 2002 (Annex 2) Safety & Traffic Services
WSI Refinements 6. Basic Walking Security (BWS) Index BWS = (WPCE–PIP) X (IPC-F) …(6) Revised to: Intersection Volume and Design (IVDI) Index IVDI = V1x V2 x V3 x V4 x V5 x V6 x V7 x V8 Where: V1= number of passenger car equivalents/hour V2 = number of pedestrians/hour V3 = number of lanes rating V4 = number of lanes by type rating V5 = intersection geometry rating V5 = intersection slope rating V7 = direction(s) of traffic flow rating V8 = number of channels adjacent to intersection rating Safety & Traffic Services
WSI Refinements Aggressive Driving Indexes: Formulas …(7), (8), (9), (10) were combined to become:Driver Behaviour Index (DBI) DBI = ALI + RLI + FTYI P P P…(11) Where: ALI = amber-light incidents per phase, P RLI = red-light incidents per phase, P FTYI = fail-to-yield incidents per phase, P Safety & Traffic Services
WSI …What is it? • WSI is a composite index • Intersection Volume and Design Index (IVDI) • Quality of Infrastructure Condition Index (QICI) • Driver Behaviour Index (DBI) • Examines 39 variables in four quadrants of each • intersection being reviewed • 33 intersections were examined in the Pilot Study • since 1998, resulting in over 200 tables Safety & Traffic Services
WSI …What does it do? • Purports to describe the walking security • experience of pedestrians at signalized • intersections …but does it? • Purports to provide a score ranking of • pedestrians’ experiences in relation to their • expectations … but does it? • Example of Ranking … Safety & Traffic Services
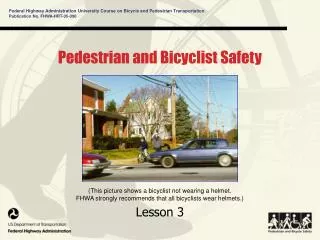
WSI …Staff concerns • We are committed to improving safety for all road • users, especially vulnerable road users (pedestrians, • cyclists, seniors, disabled) – WSI does not consider • pedestrian types or cyclists • WSI does not consider collision experience • WSI does not consider pedestrian disregard for • traffic signals • WSI data collection requirements are far too onerous • and costly to perform by City staff • WSI cannot be used to prioritize safety improvements • through any form of cost/benefit analysis Safety & Traffic Services
WSI …Staff concerns • WSI does not appear to be technically sound or • legally defensible • Use of the WSI to rank priorities for roadway • infrastructure modifications for the limited funds • available, could needlessly expose the City • to liability/litigation Safety & Traffic Services
Why was a Transportation Engineering Consultant retained to conduct a Technical Review of the WSI Project? • To provide an objective, independent, expert • assessment of the WSI with respect to: • Technical validity • Mathematical soundness - through examination of: • Indexes on which it is based and • Weighting assigned to index variables • Defensibility in court should liability issues arise • as a result of WSI • Data collection and input requirements Safety & Traffic Services
Why was a Transportation Engineering Consultant retained to conduct a Technical Review of the WSI Project? • To asses the results it produces against outcomes • derived from the application of existing Traffic • Engineering techniques, approved by that • profession as being both cost-effective and sound • engineering practice Safety & Traffic Services
What are we doing to improve safety for Vulnerable Road Users? • Extracting information from over 13,000 Motor Vehicle • Accident Reports annually to maintain an up-to-date • collision database • Implementingremedial measures at “high collision locations” and other sites of concern through our Safety Improvement Program • Responding to over 7,000 citizen concerns and • service requests for traffic and street lighting • services per year • Conducting over 800 traffic surveys per year to • address the need for new all-way stop controls, • traffic control signals, pedestrian signals, Adult • Crossing Guards Safety & Traffic Services
What are we doing to improve safety for Vulnerable Road Users? • Providing “Rules of the Road” awareness to children • through our Elementary School Outreach Program • Providing new sidewalks and recreational pathways • each year • Providing new cycling lanes as part of all road • construction and intersection modification projects • Installing audible features at new traffic control • signals installation • Participating in the Red Light Camera Pilot Project Safety & Traffic Services
What are we doing to improve safety for Vulnerable Road Users? • Learning from experience where right-turn cut-off • ramps should not be constructed, or even considered, • in view of pedestrian activity • Installing over 20 new traffic control and • pedestrian signals in 2003 • Working in partnership with Police Services and • the Health Department to develop and deliver the • Integrated Road Safety Program, that focuses on the • needs of Vulnerable Road Users Safety & Traffic Services
Show new design of Laurier/Nicholas EXISTING GEOMETRY Safety & Traffic Services
Dr. John Robinson Safety & Traffic Services