Download

1 / 11
200 likes | 824 Views
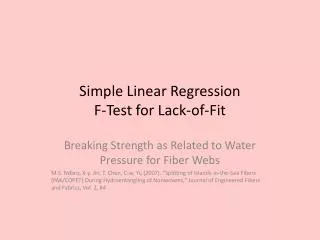
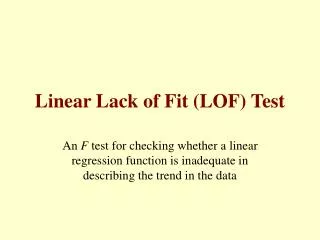
Uji F untuk ketidakcocokan model F test for lack of fit. Analisis Regresi. Case ilustration.

E N D
Uji F untukketidakcocokan modelF test for lack of fit AnalisisRegresi analisis regresi
Case ilustration • Misalkan ingin diperiksa apakah ada hubungan antara suatu hasil reaksi kimia dan temperatur. Disini hasil reaksi dipandang sebagai variabel respon (Y) sedangkan temperatur sebagai variabel independen/ bebas (X). Data sebagai berikut : analisis regresi
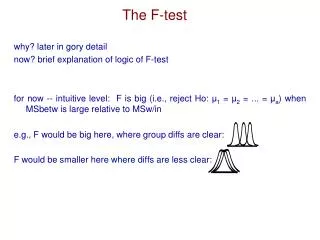
Inferensi Review singkat : Untuk melakukan inferensi dalam analisis regresi--uji linearitas dapat melalui : • Inferensi untuk slope , • Selang kepercayaan (1- α) 100% untuk slope • Uji hipotesis apakah β₁= 0 (t , F) • Inferensi untuk ρ , uji hipotesis apakah ρ = 0 • Uji ketidakcocokan, yaitu uji untuk memeriksa apakah model yang telah kita estimasi masih kurang sesuai dengan data yang kita punyai. Namun uji ini hanya dapat dilakukan apabila untuk beberapa X terdapat observasi replikasi dalam Y. analisisregresi
Dari data reaksikimia, akandilakukanujiketidaksesuaian, denganmemperhatikanadabeberapa X yang mengalamireplikasi • Hipotesis • H0 : tidakadaketidakcocokan model • (= regresinyacocok) • H1 : adaketidakcocokan model • (=regresinyatidakcocok) • Tingkat signifikansiα= 0.05 • Statistikuji : F = • Dengan k = banyaknya X yang berbeda analisisregresi
Dekomposisi JKG • JKKM = jumlahkuadratketidakcocokan model • JKGM = jumlahkuadratgalatmurni • JKG = JKKM+JKGM Daerah kritis : Ho ditolakjika F hitung > F tabel Penghitungan : • Untuk X1 = 150, = (77.4+76.7+78.2)/3 = 77.43 dan X2 = 200, = (84.1+84.5+83.7)/3 = 84.1 X3 = 250, = (88.9+89.2+89.7)/3 = 89.27 dan X4 = 300, = (94.8+94.7+95.9)/3 = 95.13 analisis regresi
JKGM={(77.4-77.43)2+(76.7-77.43)2+(78.2-77.43)2}+{(84.1-84.1)2+(84.5-84.1)2+(83.7-84.1)2}+{(88.9-89.27)2+(89.2-89.27)2+(89.7-89.27)2}+{(94.8-95.13)2+(94.7-95.13)2+(95.9-95.13)2} = 1.1267+0.32+0.3267+0.8867 • = 2.6601dengan db = 12 - 4 = 8 • JKG = 4.0115 • JKKM = JKG- JKGM = 4.0115-2.6601 = 1.3514, dengan db = 4 - 2 = 2 analisis regresi
Jadi ,Fhit = = 0.6757/0.3325 = 2.03sedangkan F table = F(2;8;0.05) = 4.46 • KarenaFhit < f tablemakah0diterimaartinyatidakadaketidakcocokanmodel ataudapatdikatakankalauregresinyacocok. • Cara hitung lain untuk JKGM : analisis regresi
Cara lain • JKGM= 77.42+76.72+78.22- } +{84.12+84.52+83.72- } +{88.92+89.22+89.72- } +{94.82+94.72+95.92- } = 2.6601 analisis regresi
Decomposition of SSE • SSE = error sum of squares • SSPE = pure error sum of squares • SSLF = lack of fit sum of squares analisis regresi
Ilustration analisis regresi
Only use • If there is replication of X analisis regresi