Download
1 / 18
180 likes | 254 Views
Election Campaign 2014: What the PSA UMR Survey told us about our members and their concerns. May 2014 Conor Twyford PSA Campaign Organiser. Background information. Main purpose – to test members’ issues of concern, enrolment status, voting patterns and social media use

E N D
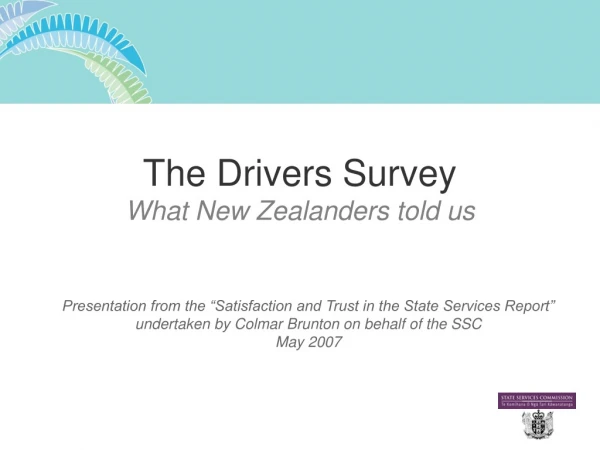
Election Campaign 2014: What the PSA UMR Survey told us about our members and their concerns May 2014 Conor Twyford PSA Campaign Organiser
Background information • Main purpose – to test members’ issues of concern, enrolment status, voting patterns and social media use • 1,000 PSA members completed the survey by email during 1st week of March • Comparable with UMR’s NZ-wide fortnightly Omnibus survey
2. Enrolment and voting … or, the world is run bythose who turn up
Are you enrolled to vote? In the 2008 election, only 81% of young Kiwis were registered to vote – the number of unenrolled (19% or 78,000) was nearly as many as all the other age groups combined. In the 2011 election, only 77% of New Zealanders aged 18 to 24 were enrolled by the Friday before polls closed. Source: UMR, Statistics NZ
Non-voting by age (in %) Young people and non-voting Non-voting by age (%) In New Zealand elections since 1987, 25 – 40% of eligible voters under the age of 25 have not voted. In 2011, 42 percent of people aged 18–24 years DID NOT VOTE Source: http://thepulse.org.nz/me/my-rights/political/voting-habit/
Did you vote in the 2011 general election or were you unable to for some reason? More non-voters in younger age group There are more non-voters aged 18–24 years than in the older age groups. Only 5.2 percent of people aged 65 or over did not vote in the last general election, compared with 42 percent of people aged 18–24. Source: UMR, Statistics NZ
Main reasons you didn’t vote? Source: UMR, Statistics NZ
Young people say… • “I don’t think my vote will make a difference”: All politicians are the same; my vote won’t change anything. • “I’m in the dark”: I don’t understand the political system and I don’t know enough about the candidates. • “It’s not on my wavelength”: Politics is nasty and boring; I’m just not interested. • “Voting doesn’t matter to me or to anyone else”: There are no benefits in voting; I don’t feel I have a duty to vote. Source: Electoral Commission
How do you intend to cast your party vote in 2014? For a look at how the polls vary across ages, see: http://find.ipsos.co.nz/Fairfax-Ipsos/14.02/Poll14.02.15/index.html
Social media use is BIG Members aged 18-39 are much more active on social media • Facebook – 81% (cf 57% of all members) • YouTube – 44% (cf 25%) • Instagram – 14% (cf 6%) • Twitter – 10% (cf 4%) We also know: • 32% of younger members rely solely on their mobile (i.e., have no landline) compared to 19% of members overall • 84% browse the internet/check their emails on their mobile compared to 57% of members overall
Conclusions • Members are concerned about survival – pay, wages, cost of living • Overall PSA members tend to be enrolled and to vote – but what about our friends and contacts? • There is a lot of potential to mobilise our members – especially around a digital campaign, and especially younger members • How can we help Get Out the Vote?