Download
1 / 8
80 likes | 105 Views
The renewable energy sectoru2019s growth in the next 5 years is set to skyrocket according to International Energy Agency (IEA) report with solar photovoltaic (PV) energy technologies leading the way. This high penetration of solar PV energy being fed into the electrical grid brings in its share of challenges and is making the grid more and more vulnerable, and unstable, which needs a definitive solution

E N D
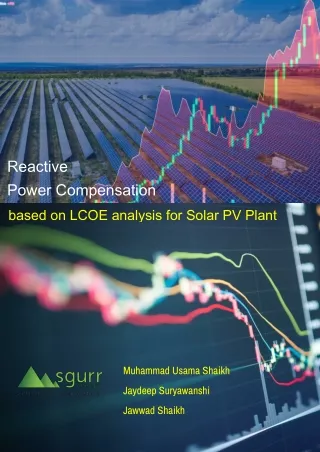
Reactive Power Compensation based on LCOE analysis for Solar PV Plant Muhammad Usama Shaikh Jaydeep Suryawanshi Jawwad Shaikh
1 Abstract The renewable energy sector’s growth in the next 5 years is set to skyrocket according to International Energy Agency (IEA) report1 with solar photovoltaic (PV) energy technologies leading the way. This high penetration of solar PV energy being fed into the electrical grid brings in its share of challenges and is making the grid more and more vulnerable, and unstable, which needs a definitive solution. This paper addresses one such challenge, of voltage profile improvement with reactive power compensation at the point of interconnection. The main concern is that solar PV plant PPA’s are with a rating of MWac/MWp and not MVA. IEEE Std 1547/UL 1741 compliant inverters will typically not have reactive power capability & operate with a unity power factor. Though modern inverters are, having a capacity to supply reactive power in the range of +0.8 lead/-0.8 lag, albeit the PV plant is rated based on the AC power supplied by the inverter at unity PF. This leads to an inherent error in the per-unit cost calculation, as when the inverter is providing the reactive power the active power is hampered. The paper highlights a cost base analysis of various scenarios such as inverters working at unity power factor, plants working with capacitor banks compensation, plants working with an excess number of inverters & plants providing reactive power support with small reactive compensation equipment & a small number of extra inverters. It is concluded that the latter case is the most cost effective and economical. 1 https://www.iea.org/reports Certified to ISO 9001, 14001 and 45001 Page 1 of 7
2 Introduction The renewable energy sector’s growth in the coming years is to set skyrocket according to International Energy Agency (IEA) report. With Solar photovoltaic energy leading the way, this growth is happening because of the reduced costs of renewable energy technologies, global set targets and decarbonisation policies, and the increasingly high electricity demand. For the design of Solar Photovoltaic plants capacity, there are various factors to be considered mainly, the geographical location of the proposed site, annual sunny day, weather forecasting, type of PV module used, type of Inverter & its topology, and many other factors but the amount of reactive power support is never really calculated by the design engineers. This is done to have a better economic advantage. 2.1 Define Reactive Power. It is the form of electricity that creates or is stored in the magnetic field surrounding a piece of equipment. Reactive power can be positive or negative. The amount of current in a device impacts the amount of reactive power needed. If you double the amount of power being consumed in an area, the reactive power consumed quadruples. Reactive power consumption, therefore, is a vital aspect of managing the network. This is typically done by adding reactive compensating devices. 2.2 Reactive Power in solar PV plant Historically the Solar Photovoltaic (PV) plant was always considered as a support for the main grid and the newer problems were never encountered but the increase in the number of Solar Projects and the subsidies provided by various world organizations, the demand for decarbonization, and the falling cost(financial benefits) of PV plants have made the renewable sector to affluent. Solar PV plant PPA’s are with a rating of MWac/MWp and not MVA. They are usually considered only for the production of active power, with the increase in penetration for solar PV the need for solar plants to supply reactive power is of utmost importance. With modern inverters, this is achievable but at the cost of Active Power. 2.3 LCOE analysis of solar plant The Levelized cost of energy (LCOE), also referred to as the Levelized Cost of electricity or the Levelized energy cost (LEC), is a measurement used to assess and compare alternative methods of energy production. The LCOE of an energy-generating asset can be thought of as the average total cost of building and operating the asset per unit of total electricity generated over an assumed lifetime. Alternatively, the Levelized Cost of energy can be thought of as the average minimum price at which the electricity generated by the asset is required to be sold in order to offset the total costs of production over its lifetime. Calculating the LCOE is related to the concept of assessing a project’s net present value. ??? ??????? ????? ?? ????? ???? ???? ???????? ??? ??????? ????? ?? ?????????? ?????? ???????? ???? ???????? ???? = For this paper, we have kept constant all the costs related to solar plants with only considering the change in reactive power related costs. Certified to ISO 9001, 14001 and 45001 Page 2 of 7
3 Case Studies The paper gives a comprehensive performance and economical/financial comparison of solar PV plants working with various configurations for reactive power support as per the highlighted cases below Case-1: As a base model we have Inverter functioning always at a unity power factor i.e. 100% Active power generation ideally Case-2: At actual Inverter functioning with 10% reactive power support i.e. Active + Reactive power generation Case-3: Reactive power compensation equipment installed (Capacitor Bank) to function the inverter at unity power factor (100% Active Power Produces). Case-4: An additional 15% Inverters installed to help in reactive power support as required by the PPC. The idea is to show a comparison based on the LCOE cost and not on Payback cost because we have only considered from the generation point of view and not considering the grid penalties and other charges suffered by the client To run a cost model for all the above cases, we consider a 140MWac Solar Plant & a P50 energy yield prediction for our above test cases. Table No -1 below showcases the type of Module technology, the DC-AC installed capacity, Pitch and Tilt range as constant for all the cases. Sr. No. Parameters Magnitude 1 PV module Technology Mono PERC 2 Inverter Type String 3 Inverter Rating 185kVA 4 Installed Capacity (MWp) 196.00 5 Installed Capacity (MWAC) 140.00 6 Pnom Ratio 1.40 Table 1- Solar Plant Capacity Keeping all other cost effecting parameters as constant, and only keeping the active & reactive power component as the variable cost for testing the cases. Generic case- Usually PV plant cost models are based on the consideration that the PV plant operates at a unity power factor which in practice is false, and to have a correct cost model we have to consider the actual power factor expected at the point of common coupling as seen in figure-1 3.1 Case-1 To do a comparative analysis, case-1 is considered to have a power factor of unity and an energy yield forecast by PVsyst P50 model for the 1st year to be 3,51,097 MWh (Annual Yield) which in the 25th year would be 3,11,302MWh (Annual Yield). Certified to ISO 9001, 14001 and 45001 Page 3 of 7
Figure 1-Case-1 3.2 Case-2 Assuming a grid that is always performing at a 0.9 power factor and the required reactive power is supported by the inverters which will be hampering the generation of active power as seen in the picture below. Figure 2- Case-2 Considering the above scenario an energy yield forecast by PVsyst P50 model was done for which the 1st year yield was 3,27,670 MWh (Annual Yield) and at the 25th year to be 2,90,530MWh (Annual Yield). Certified to ISO 9001, 14001 and 45001 Page 4 of 7
3.3 Case-3 The reactive power compensation equipment (i.e. Capacitor Bank) which will help the grid attain its desired power factor and inverters to perform only for active power generation as seen in the picture below supports assuming a grid that is always performing at a 0.9 power factor and the required reactive power. Figure 3-Case-3 Considering the above scenario an energy yield forecast by PVsyst P50 model was done for which the 1st year yield was 3,51,097MWh (Annual Yield) and at the 25th year to be 3,11,302MWh (Annual Yield). 3.4 Case-4 Assuming a grid that is always performing at a 0.9 power factor and the 50% of the required reactive power is supported reactive power compensation equipment (i.e. Capacitor Bank) and the other 50% by extra inverters installed which will help the grid attain its desired power factor as seen in the picture below. Figure 4-Case-4 Certified to ISO 9001, 14001 and 45001 Page 5 of 7
Considering the above scenario an energy yield forecast by PVsyst P50 model was done for which the 1st year yield was 3,51,097 MWh (Annual Yield) and at the 25th year to be 3,11,302MWh (Annual Yield). 3.5 Summary An overall summary of the above cases is highlighted in Table 2 below. Case-1 Sr. No. Description Unit Case-2 Case-3 Case-4 (Base Case) 1 Active Power MW 140 140 140 140 Energy Yield 1st Year 2 MWh 3,51,097 3,27,670 3,51,097 3,40,380 Energy Yield 25th Year 3 MWh 3,11,302 2,90,530 3,11,302 3,01,799 4 Reactive Inverter Power by % MVAr 0% 100% 0% 50% 5 Reactive Capacitor Bank Power by % MVAr 0% 0% 100% 50% 6 LCOE INR/kWh 3.696 3.961 3.701 3.721 Table 2- Case Summary Certified to ISO 9001, 14001 and 45001 Page 6 of 7
4 Conclusion 01.As per CEA guidelines and grid codes, if reactive power obligation becomes a stringent requirement in the coming years, LCOE based P-Q analysis tool will help to optimize solar plant design. 02.As per comparative analysis, Option-3 consideration of capacitor banks is an optimized option to fulfill reactive power obligations. 03.It is evident from the above table-2, that there is approximately a 0.2 INR/kWh difference in LCOE when the Solar power plant is equipped with reactive power compensation equipment such as a Capacitor Bank, Harmonic Filter, etc., and the LCOE of the Solar Plant without reactive power compensation equipment. Where usually 0.2 INR/kWh is the loss on investment and many times the margin at which the plant bid is won. Certified to ISO 9001, 14001 and 45001 Page 7 of 7