Download
1 / 26
280 likes | 429 Views
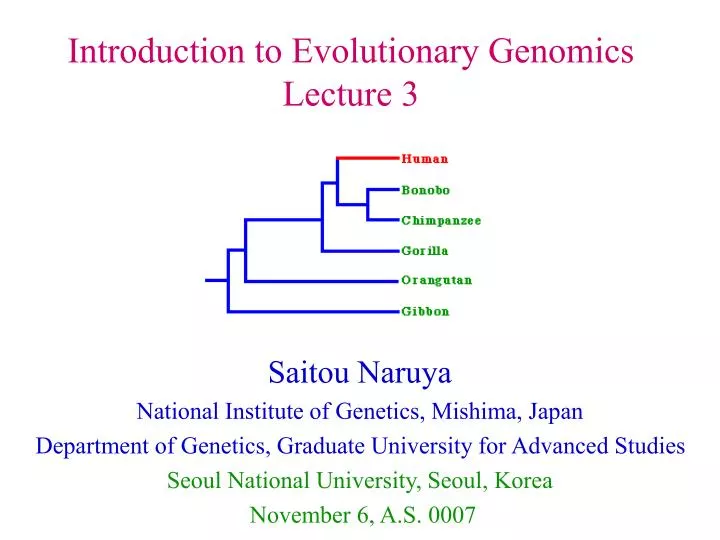
Introduction to Evolutionary Genomics Lecture 3. Saitou Naruya National Institute of Genetics, Mishima, Japan Department of Genetics, Graduate University for Advanced Studies Seoul National University, Seoul, Korea November 6, A.S. 0007.

E N D
Introduction to Evolutionary Genomics Lecture 3 Saitou Naruya National Institute of Genetics, Mishima, Japan Department of Genetics, Graduate University for Advanced Studies Seoul National University, Seoul, Korea November 6, A.S. 0007
Introduction to Evolutionary GenomicsContents of Lecture 3 • Genomes of diverse organisms • Various aspects of genome evolution • Alignment • Estimation of nucleotide substitutions • Methods for phylogenetic tree construction (2)
Example of multiple alignment AGGTGGTGGTGGACA Human AGGTGGTGGTGGACA Chimpanzee AGGTGG---TGGACA Gorilla AGGTGG---TGGACA Orangutan AGGTGGTGGTAGACA Old World Monkey
Two possible explanation of multiple alignment Human Chimpanzee Gorilla Orangutan Old World Monkey
Two possible pairwise alignments For same two sequences (A)配列1 ATGCGTCGTT 配列2 ATCCG-CGAT (B)配列1AT--GCG-TCGTT 配列2ATCCGCGAT
Different outcomes can be obtained by changing gap penalties Human = Rh50_trembl_O43514, medaka = Rh50_ AB036511 (A) gapopen = 10, gapext = 0.2, gapdist = 8 human GILQSQGQXXXKFNIGIKNMINADFSAATVLISFGAVLGKTSPTQMLIMTILEIVFFAHN medaka GWFHHFDYSTGKIYIGIESLINADFCCAASLIAYGAILGKVSPVQLMVVTLFGVTLFAVE * :: . *: ***:.:*****..*: **::**:***.**.*::::*:: :.:** : (B) gapopen = 2, gapext = 0.1, gapdist = 4 human GILQXXXXSQGQKFNIGIKNMINADFSAATVLISFGAVLGKTSPTQMLIMTILEIVFFAH medaka GWFHHFDYSTGXKIYIGIESLINADFCCAASLIAYGAILGKVSPVQLMVVTLFGVTLFAV * :: * * *: ***:.:*****..*: **::**:***.**.*::::*:: :.:**
Graphical representation of Long stretch of homologous regions (A) pip(B) GenomeVista (A) (B)
Relationship of different nucleotide substitution models N N: No. parameters RAND:完全任意モデル GTR:一般時間可逆モデル SYM:対角対称モデル GIN:五條堀-石井-根井のモデル TN:田村-根井のモデル TK5:高畑-木村の5変数モデル HKY:長谷川-岸野-矢野のモデル TK4:高畑-木村の4変数モデル EI:等入力モデル B4:BarryとHartiganの4変数モデル K3:木村の3変数モデル T3:田村の3変数モデル K2:2変数法のモデル JC:1変数法のモデル GTR TN
Estimation of branch lengths from pairwise distances D[E,G] = B[E-W] + B[W-G] B[W-G] = {D[E,G] + D[F,G] - D[E,F]}/2
Distance matrix when strict molecular clock holds ================== ア イ ウ エ オ ア 0 1 2 4 4 イ 1 0 2 4 4 ウ 2 2 0 4 4 エ 4 4 4 0 3 オ 4 4 4 3 0 ==================
============================ Nucleotide Position 11111111112 12345678901234567890 ---------------------------- 配列ア aacgtttcatgagatacgtg 配列イ .t.......g.......... 配列ウ c........ga......... 配列エ ctac.....g.t........ 配列オ cta.ga...g.......... 配列カ ctacga...g..cg...... 配列キ ctacgag..g.......... 配列ク ctacgag..g....a..... 配列ケ ctacgagtcg.....g.... 配列コ ctacgagttg.......... ============================
Reduced sequences after SSJ operation ================= 配列ア aacgtt 配列イ .t.... 配列ウ c..... 配列エ ctac.. 配列オ cta.ga 配列* ctacga ================= *=カ,キ,ク,ケ,コ
Finding maximum parsimony tree by sequence addition
Finding maximum parsimony tree by site addition
Maximum Likelihood Method Using NJ-like search (Saitou 1989)
---------------------------------------------------------------------------------------------------------------------------------------------------------------------------------------------------------------------------------------------------------------------------------------------------------------- 1 2 3 4 5 6 7 8 9 -------------------------------------------------------------------------------------------------------------------------------------------------------- 2 0.0516 3 0.0550 0.0031 4 0.0483 0.0221 0.0253 5 0.0582 0.0651 0.0685 0.0549 6 0.0094 0.0416 0.0450 0.0384 0.0549 7 0.0125 0.0584 0.0619 0.0551 0.0651 0.0157 8 0.0284 0.0687 0.0722 0.0654 0.0754 0.0317 0.0285 9 0.0925 0.1221 0.1259 0.1185 0.1370 0.0820 0.0786 0.0927 10 0.1921 0.2183 0.2228 0.2054 0.2309 0.1798 0.1795 0.1833 0.1860 --------------------------------------------------------------------------------------------------------------------------------------------------------
Construction of phylogenetic network from distance matrix data