Download
1 / 38
390 likes | 582 Views
Ecosystems: What Are They and How Do They Work?. Chapter 3 Sections 1-4. Key Concepts. What is ecology? Major components of ecosystems Energy flow and matter cycles What are soils and how do they form? Ecosystem studies. Importance of Insects. Ecological Services Pollination

E N D
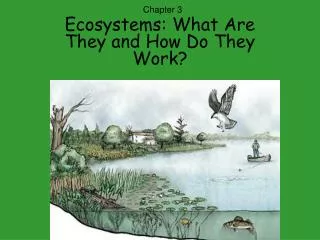
Ecosystems: What Are They and How Do They Work? Chapter 3 Sections 1-4
Key Concepts • What is ecology? • Major components of ecosystems • Energy flow and matter cycles • What are soils and how do they form? • Ecosystem studies
Importance of Insects Ecological Services • Pollination • Pest control • Important roles in biological community
Nature of Ecology • What is ecology?Study of connections in nature • Organisms • Cells • Species • Microbes rule!Benefits Include:Decomposition, nutrient cycling, foods, water purification, digestion, antibiotics
Nature of Ecology Known species 1,412,000 Other animals 281,000 Insects 751,000 Fungi 69,000 Prokaryotes 4,800 Plants 248,400 Species Total?Estimated 3.6 - 100 million Protists 57,700
Animation Levels of organization interaction
Levels of Organization of Matter See Fig. 3-4, p.42
What Sustains Life on Earth? • Troposphere: Earth’s surface to 17km up-78% N, 21% O2 • Stratosphere- 17 - 48 km contains ozone layer • Hydrosphere • Lithosphere= crust & upper mantle • Biosphere = Zone of Earth where life is found (skin of the apple)* All parts are interconnected! Fig. 3-2, p. 41
What Sustains Life on Earth? Oceanic crust Continental crust Atmosphere Vegetation and animals Biosphere Lithosphere Soil Upper mantle Crust Asthenosphere Rock Lower mantle Core Mantle Crust (soil and rock) Biosphere (living and dead organisms) Lithosphere (crust, top of upper mantle) Hydrosphere (water) Atmosphere (air) Fig. 3-2, p. 41
Earth’s Life-Support Systems(3 interconnected factors) • One way flow of high-quality energy • Cycling of matter • Gravity- holds atmosphere, enables movement of chemicals thru various spheres “Energy flows, nutrients cycle.”
Earth’s Life-Support Systems “Energy flows, nutrients cycle.” Biosphere Nitrogen cycle Carbon cycle Phosphorus cycle Water cycle Oxygen cycle Heat in the environment Heat Heat Heat
Flow of Solar Energy to and from the Earth • Greenhouse gaseswater vapor, CO2 NO, CH4 , O3 • Greenhouse effect- Heat trapped in the troposphere to warm planetwithout natural greenhouse effect life would not be possible. See Fig. 3-3, p. 41
Solar radiation Energy in = Energy out Reflected by atmosphere (34%) Radiated by atmosphere as heat (66%) UV radiation Lower Stratosphere (ozone layer) Troposphere Absorbed by ozone Greenhouse effect Visible light Heat Absorbed by the earth Heat radiated by the earth Flow of Solar Energy to and from the Earth Fig. 3-3, p. 41
Animation Sun to Earth animation
Why is the Earth so Favorable for Life? • Liquid water • Temperature- Past 3.7 billion years average surface temp. = 50- 68 °F • Gravity • Atmosphere
Major Biomes Average annual precipitation 100–125 cm (40–50 in.) 75–100 cm (30–40 in.) 50–75 cm (20–30 in.) 25–50 cm (10–20 in.) below 25 cm (0–10 in.) 4,600 m (15,000 ft.) 3,000 m (10,000 ft.) 1,500 m (5,000 ft.) Rocky Mountains Mississippi River Valley Sierra Nevada Mountains Great American Desert Great Plains Appalachian Mountains Coastal mountain ranges Coastal chaparral and scrub Coniferous forest Desert Coniferous forest Prairie grassland Deciduous forest
Major Components of Freshwater Ecosystems Sun Producers (rooted plants) Producers (phytoplankton) Primary consumers (zooplankton) Tertiary consumers (turtles) Secondary consumers (fish) Dissolved chemicals Sediment Decomposers (bacteria and fungi)
Major Components of a Field Ecosystem Sun Oxygen (O2) Producer Carbon dioxide (CO2) Secondary consumer (fox) Primary consumer (rabbit) Producers Falling leaves and twigs Precipitation Soil decomposers Water Soluble mineral nutrients Fig. 3-5, p. 43
Animation Matter recycling and energy flow animation
ABC’s of Ecology(The study of how organisms interact with one another & their non-living environment) • A= Abiotic (Non-living) • B= Biotic (Living) • C= Cultural (Human Interactions)
Factors Limiting Population Growth • Limiting factor principle-Too much or too little of any abiotic factor can limit or prevent growth of population. • Limiting factors:Excess water or water shortages for terrestrial organisms Excess or lack of soil nutrients Dissolved oxygen for aquatic organisms Salinity for aquatic organisms
Range of Tolerance Lower limit of tolerance Upper limit of tolerance No organisms Few organisms Few organisms No organisms Abundance of organisms Population Size Zone of intolerance Zone of intolerance Optimum range Zone of physiological stress Zone of physiological stress Low Temperature High
Factors That Limit Population Growth • Range of tolerance:range of abiotic conditions required for population to survive • Law of tolerance “The existence, abundance and distribution of a species in an ecosystem are determined by whether the levels of one or more physical or chemical factors fall within the range tolerated by that species.”
Consumers: Feeding and Respiration • Decomposers (Fungi & Bacteria) - specialized consumers that breakdown detritus (dead stuff) into inorganic nutrients that can be reused by producers • Omnivores • Detritivores- Decomposers & detritus feeders • Aerobic respirationglucose + oxygen = carbon dioxide + water + ENERGY
Detritivores Detritus feeders Decomposers Decomposers convert organic chemicals to inorganic chemicals that can be used by producers Termite and carpenter ant work Carpenter ant galleries Bark beetle engraving Long-horned beetle holes Dry rot fungus Wood reduced to powder Mushroom Time progression Powder broken down by decomposers into plant nutrients in soil Fig. 3-6, p. 44
Main Structural Components of an Ecosystem Abiotic chemicals (carbon dioxide, oxygen, nitrogen, minerals) Heat Solar energy Heat Heat Producers (plants) Decomposers bacteria, fungi) Consumers (herbivores, carnivores) Heat Heat Fig. 3-7, p. 45
Animation Linked processes animation
Animation The role of organisms in an ecosystem
Biodiversity(4 Components) Fig. 3-14, p. 45
Examples of Biodiversity Fig. 3-15, p. 46
Model of a Food Chain First Trophic Level Second Trophic Level Third Trophic Level Fourth Trophic Level Producers (plants) Primary consumers (herbivores) Secondary consumers (carnivores) Tertiary consumers (top carnivores) Heat Heat Heat Solar energy Heat Heat Heat Heat Detritivores decomposers and detritus feeders) Heat Fig. 3-8, p. 46
Food Web in the Antarctic Humans Sperm whale Blue whale Elephant seal Killer whale Crabeater seal Leopard seal Adélie penguins Emperor penguin Petrel Fish Squid Carnivorous plankton Herbivorous zooplankton Krill Phytoplankton Fig. 3-9, p. 46
Energy Flow in an Ecosystem • Biomass • Ecological efficiency= % of usable energy transferred as biomass from one trophic level to the next (2% - 40%)10% Rule-assumes 10% ecological efficiency • Pyramid of energy flow
Ecological Pyramids (3 Types) Heat Heat Decomposers Tertiary consumers (human) Heat 10 100 1,000 10,000 Usable energy available at each tropic level (in kilocalories) Secondary consumers (perch) Heat Primary consumers (zooplankton) Heat Producers (phytoplankton) See Fig. 3-10, p. 47
Biomass Productivity • Gross primary productivity (GPP)rate at which producers in an ecosystem convert sun into food • Net primary productivity (NPP)= GPP - Respiration • NPP and populationsNPP limits the number of consumers that can live on earth
Differences between GPP and NPP Sun Photosynthesis Energy lost and unavailable to consumers Respiration Gross primary production Net primary production (energy available to consumers) Growth and reproduction
Net Primary Productivity in Major Life Zones and Ecosystems Terrestrial Ecosystems Swamps and marshes Tropical rain forest Temperate forest Northern coniferous forest (taiga) Savanna Agricultural land Woodland and shrubland Temperate grassland Tundra (arctic and alpine) Desert scrub Extreme desert Aquatic Ecosystems Estuaries Lakes and streams Continental shelf Open ocean 800 1,600 2,400 3,200 4,000 4,800 5,600 6,400 7,200 8,000 8,800 9,600 Average net primary productivity (kcal/m2/yr) Fig. 3-11, p. 48