Download
1 / 32
320 likes | 403 Views
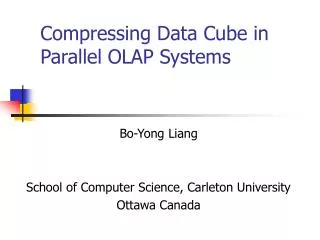
Analysis of Additivity in OLAP Systems. John Horner and Il-Yeol Song john.horner@drexel.edu College of Information Science & Technology Drexel University Philadelphia, PA 19104 USA Peter P. Chen Department of Computer Science Louisiana State University Baton Rouge, LA 70803.

E N D
Analysis of Additivity in OLAP Systems John Horner and Il-Yeol Song john.horner@drexel.edu College of Information Science & Technology Drexel University Philadelphia, PA 19104 USA Peter P. Chen Department of Computer Science Louisiana State University Baton Rouge, LA 70803
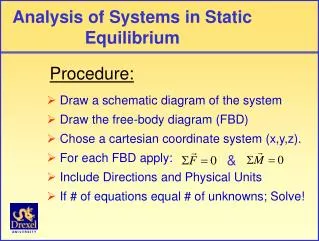
Online Analytical Processing (OLAP) Systems • Historical, integrated, relatively static data • Magnitudes larger than transactional systems • Used for strategic decision making • Query outputs nearly always aggregated sets of base data • Effective summarizability is of paramount concern
Structure • Facts are measures of interest • Dimensions are attributes used to identify, select, group, and aggregate measures of interest. • Attributes that are used to aggregate measures are labeled classification attributes, and are typically conceptualized as hierarchies
Operations • Roll-up increases the level of aggregation along one or more classification hierarchies • Drill-down decreases the level of aggregation along one or more classification hierarchies • Slice-Dice selects and projects the data • Pivoting reorients the multi-dimensional data view to allow exchanging facts for dimensions symmetrically • Merging performs a union of separate roll-up operations
Additivity • The ability to use the aggregate summation operator to accurately summarize data is known as Additivity • A measure is Additive along a dimension if the sum operator can be used to meaningfully aggregate values along all hierarchies in that dimension • Fully-additive measures are additive across all dimensions • Semi-additive measures are only additive across certain dimensions • Non-additive measures are not additive across any dimension
Additivity Example Customer Date
Non-Additive Measures • Ratios and Percentages • Measures of Intensity • Average / Maximum / Minimum • Measures of Direction
Semi-Additive Facts • Dirty Data • Changing Data • Temporally Non-Additive • Categorically Non-Additive • Not Mutually Exclusive • e.g. Measures can be both temporally and categorically non-additive
CustomerID 000001 012454 201454 745654 999999 Customers as Stored in Database Actual Customers Arbitrary Missing Data Value Causes of Dirty Data • Summing measures associated with dirty data can result in inaccurate summaries if not all instances are counted, if instances are counted multiple times, or if instances are counted in the wrong group Customer who pre-dates system
Classification Hierarchy Transactions Anomaly will disappear when rolled up to the State level Anomaly will disappear when rolled up to the zip code level Anomaly will disappear when rolled up to the country level Rolling-up Dirty Data • As measures are rolled up further along hierarchies, certain inaccurate values will be merged into the appropriate groups
Hierarchy Completeness • All instances belong to one higher level instance, which consists of those instances only • Complete hierarchy (top), country consists of only the provinces listed • Incomplete hierarchy (bottom), not all customers in the city are stored in the data warehouse; or not all customers in data warehouse have a city listed Country C1 Complete Province Pro1 Pro2 Pro3 City City Incomplete Customer Cust1 Custn Cust2 Custx
Example of Additivity Problems Associated with Incomplete Hierarchies Summary • If Sales are rolled up to the city, but not all customers have a city stored in the database, then the summary will not accurately portray the sales grouped by city.
Changing Data • It is important to track merges, splits, and overlapping hierarchies, especially those that affect classification hierarchies, as the characteristics of the data and environment change
Changing Data Example • Area code 215 split into 3 area codes. Looking at population trend in 215 area code would show a decrease, when in fact population in area originally covered by 215 area code has doubled.
Temporally Non-Additive • Measures that cannot be meaningfully added across different time periods are temporally non-additive • Examples • Account balances • Quantity on hand
Temporally Non-Additive SQL Select sum(balance), CustomerID From AccountFact Group by CustomerID; Select sum(balance), date From AccountFact Group by date; Must group by time interval of snapshot
Categorically Non-Additive • Measures that cannot meaningfully be summed across different types of items can be considered categorically non-additive • Examples • Basket counts • Quantity on hand
Categorically Non-Additive SQL Select sum(BasketCount) From SalesFact; Select sum(BasketCount), ProductName From SalesFact Group by ProductName; Must group by attribute in product family hierarchy
Others’ Suggestions • The distinction between meaningful and meaningless aggregation data should be stored in an appendix • Hüsemann et al (2000) • Data should be normalized into a General Multidimensional Normal Form (GMNF), whereby aggregation anomalies are avoided through a conceptual modeling approach that emphasizes sorting out dimensions, dimensional hierarchies, and which measures belong where. • Hüsemann et al (2000) • Conceptual models should explicitly depicts hierarchies and aggregation constraints along hierarchies, and a fact glossary should be developed describing how each fact was derived from an ER model • Golfarelli and Rizzi (1998) • We need to rigorously classify hierarchies and detailed characteristics of hierarchies, such as completeness and multiplicity • Pourabbas and Rafanelli (1999) • Slowly Changing Dimensions (Kimball and Ross, 2002) • Type 1: simply overwriting data • Type 2: storing the new data instance in a new row, but with a common field to link the dimensions as being the same • Type 3: Adding a new attribute to the dimension table to store both the new and old values
Our Suggestions • No simple solution • Can’t always eliminate potential inaccuracies • Categorically Non-additive data • Glossaries may be ignored • Conceptual models may be overly complex • This doesn’t mean that we shouldn’t have glossaries and include constraints in conceptual models • Online Summarizability Constraints • Imagine abundance of update anomalies in transactional systems if possible violations are only stored in glossaries or conceptual models • Where measures are imprecise, queries should show error bounds
Hierarchies • Strict - each object at a lower level belongs to only one value at a higher level • Non-strict - can be thought of as a many-to-many relationship between a higher level of the hierarchy and the lower level • Complete - all members belong to one higher-class object, which consists of those members only • Incomplete – not complete • Multiple path- lower object splits into two distinct higher level objects • Alternate path - multiple path hierarchy that joins again at a higher level
Hierarchy Strictness • In strict hierarchies, lower level instances in hierarchy belong to only one higher level instance D1 D2 Department Strict P1 P2 P3 P4 P5 Person D1 D2 Department Non-Strict Pr1 Pr2 Pr3 Pr4 Pr5 Project
Example of Additivity Problems Associated with Non-Strict Hierarchies Denormalized Fact Table
a. Alternate Path Classification Hierarchy Store City AreaCode ZipCode County State Country b. Multiple Path Classification Hierarchy Date Week Month DayOfWeek Quarter Year Alternate and Multiple Path Hierarchies • Inaccurate summaries can result from merging aggregates from multiple paths of a hierarchy.
Example of Problems Associated with Merging Multiple Path Hierarchies Multiple Path Hierarchy 140 hrs Person 320 hrs Department Project 460 hrs Should be 360 hrs • Adding Hours from all the people in Department 1 with all the people who worked on Project 2 results in an inaccurate summary because Person 2 is counted twice. • The summary would not be inaccurate if each project mapped directly to 1 department
Conclusions • Recognizing whether measures are fully-, semi-, or non-additive is essential to identifying and resolving potential inaccurate summaries in OLAP systems • Non-additive measures cannot be aggregated using the sum operator • Semi-additive measures can sometimes be aggregated using the sum operator, but at other times cannot • Therefore, semi-additive attributes pose the highest risk for unrecognized inaccurate summaries • There are several reasons why data could be semi-additive • Adding different types of items together • Adding measures multiple times in the same summary • Not including all instances when aggregating measures • Including measures in the wrong groups • Metadata could be used to alert analysts to potentially inaccurate queries
References • Golfarelli, M., Maio, D., and Rizzi, S. (1998). Conceptual Design of Data Warehouses from E/R Schemes. Proceedings of the Thirty-First Hawaii International Conference, 6-9 Jan. 1998, 7, 334 – 343. • Hüsemann, B., Lechtenbörger, J, and Vossen, G. (2000). Conceptual data warehouse design. Proc. International Workshop on Design and Management of Data Warehouses, 2000. • Kimball, R. and Ross, M. (2002). The Data Warehouse Toolkit: Second Edition. John Wiley and Sons, Inc. • Pourabbas, E. and Rafanelli, M. (1999). Characterizations of hierarchies and some operators in OLAP environments..Proceedings of the 2nd ACM international workshop on Data warehousing and OLAP. Kansas City, Missouri. 54 – 59. • Shoshani, A. (1997) OLAP and statistical databases: Similarities and differences. Proceedings of the sixteenth ACM SIGACT-SIGMOD-SIGART symposium on Principles of database systems. Tucson, Arizona. 185 – 196. ACM Press New York, NY.