2019 R&D and Depreciation Analysis: Impact on RNEA and Enterprise Income Forecasts
180 likes | 304 Views
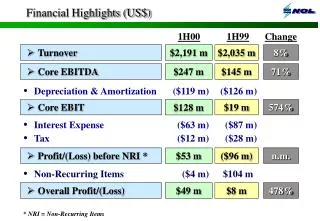
This analysis by Nick Cecero examines the implications of R&D expensing and capitalization on Residual Net Enterprise Assets (RNEA) and Enterprise Income for the fiscal year 2019. It discusses the effects of different depreciation methods over 3 and 5 years, revealing how expensing versus amortizing R&D impacts financial outcomes. Insights include comparisons of profitability, forecasting enterprise income, and the intrinsic value of the firm under various accounting approaches. The findings advocate for a shorter depreciation period to enhance reported income.

2019 R&D and Depreciation Analysis: Impact on RNEA and Enterprise Income Forecasts
E N D
Presentation Transcript
R&D & Depreciation By: Nick Cecero
R&D Expensed Against Income Steady State has been achieved during fiscal year 2019.
R&D Capitalized & Amortized Steady State has been achieved during the fiscal year 2019.
RNEA Calculation Is the same RNEA as when we expensed R&D.
Forecasted RNEA & Enterprise Income R&D Expensed R&D Capitalized The RNEA’s are different because when you capitalize R&D it is going to increase your asset base which will effect your EATO, and will also effect your EPAT because of the amount of income that will be deducted when expensed versus when it is amortized. Red = Forecasted RNEA for 2020 and was calculated using an average of the 7 years. I also expect enterprise income to hover around $60.
REI Model R&D Amortized This differs then our previous value of $109 when it was previously expensed.
Valuing The Firm Only to 2016 • When expensed there is a negative Residual Enterprise Income at the end of 2016. • When amortized you are getting a more realistic perception of the Residual Enterprise Income.
R&D Expensed Against Income (Cut of $20 Million in Expenditures) RNEA is higher despite slower sales growth because you are expensing less in the years 2016 and forward therefore increasing your Income left over which causes your RNEA to be increased despite the slower sales growth.
Depreciation 3 Years Forecasted via an average. Firm is also more profitable if depreciating over 3 years (27.69%).
Depreciation 5 Years Forecasted going forward via an average. Less profitable in 2017 using this depreciation.
Higher Earnings Reported at time of IPO • It is clearly shown through the use of the prior models that by utilizing the Residual Income Model the choice of accounting methods will not have an impact on the intrinsic value of the firm. • The difference in choices of depreciation will not have any impact on the value of the firm when we discount everything back.
Justification of One Depreciation over another • After forecasting out both income statements either using both a three year and five year approach it would seem as though by utilizing a three year approach would be better since you are recognizing more income in the year 2020 (under the 3 year method) as compared to the 5 year depreciation method. • As shown on the next slide.
Comparison 3 Year Depreciation 5 Year Depreciation Income is higher by $254 in the year 2020 and presumably this trend should continue until 2022. Which is why the 3 year depreciation would be more beneficial.
The End Any Questions?