Download

1 / 19
190 likes | 325 Views
As we navigate the Anthropocene, the impact of human activity on the nitrogen cycle has become significant. Peter Vitousek from Stanford University highlights the balance of nitrogen inputs and outputs, indicating that while some regions grapple with nitrogen deficiency, others face excess, harming the environment. This is underscored by contrasting nutrient balances in different agricultural regions, such as Kenya, North China, and the Midwest US. This report emphasizes the need for sustainable practices to ensure human well-being and environmental health.

E N D
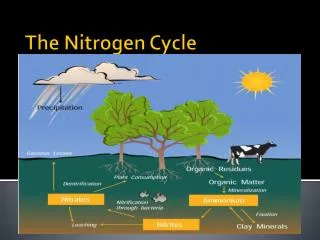
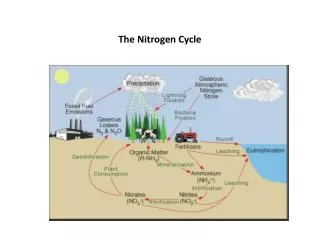
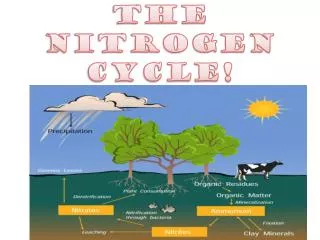
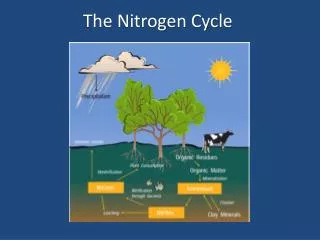
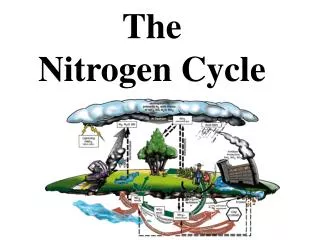
Perspectives on the Nitrogen Cycle Peter Vitousek Stanford University
We are entering the Anthropocene “the geologic epoch in which the human species has emerged as a globally significant force reshaping the face of Earth” P.J. Crutzen 2002
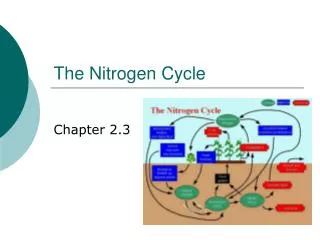
Global Terrestrial N Budget(Galloway and others 2007) “Natural” Biological N Fixation 70 - 100 Lightning 5 Total Fixed Naturally 75 – 105 Inorganic N Fertilizer 100 Crop N Fixation 30 Fossil Fuel Fixation 25 Industrial Uses of fixed N 20 Total Fixed by Humanity ~175
United States Nitrogen Budget EPA Nitrogen Report 2011
1000 1200 1400 1600 1800 2000 Year IPCC Third Assessment Report, 2001
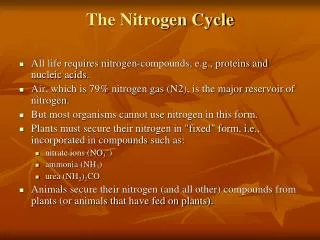
Anthropogenic reactive N is distributed unevenly across Earth In some areas we use far too little N, in others we release far too much – and both extremes damage the environment and threaten human well-being.
Comparison of Nutrient Balances Kenya North China Midwest US Maize Yield 2000 N P All in kg ha-1 y-1 Fertilizer 7 8 Removal in harvested 59 7 products Agronomic inputs minus -52 +1 harvest removals Sanchez and Palm pers. communication.
Comparison of Nutrient Balances double crop, w wheat Kenya North China Midwest US Maize Yield 2000 8500 N P N P All in kg ha-1 y-1 Fertilizer 7 8 588 92 Removal in harvested products 59 7 361 39 Agronomic inputs minus harvest removals -52 +1 +227 +53 Ju et al. 2009
Maize-Wheat double-cropping, North China Plain Ju et al. 2009
Comparison of Nutrient Balances Rotation w/soybean Kenya North China Midwest US Maize Yield 2000 8500 8000 N P N P N P All in kg ha-1 y-1 Fertilizer (plus N fixation) 7 8 588 92 155 14 Removal in harvested products 59 7 361 39 145 23 Agronomic inputs minus harvest removals -52 +1 +227 +53 +10 -9 David and Drinkwater pers communication. (Vitousek et al. 2009)
Prof. Fusuo Zhang, Dean, College of Resources and Environmental Sciences, China Agricultural University
Maize-Wheat double-cropping, North China Plain Ju et al. 2009
Yield and Fertilizer Use ISSM versus Farmer Practice Farmer Practice ISSM Maize Yield (t/ha) 6.8 (1.6) 13.0 (1.6) N input (kg/ha) 257 (121) 237 (70) Yield per unit N added (g/g) 26 (20) 57 (13) N inputs minus harvest removals (kg/ha) +127 (42) -12 (56) Chen et al. 2011
We are entering the Anthropocene “the geologic epoch in which the human species has emerged as a globally significant force reshaping the face of Earth” P.J. Crutzen 2002