GeoMapApp & JMARS: Geospatial Technology Tools for Ocean and Mars Data Visualization
GeoMapApp is Java-based GIS tool for ocean data while JMARS is for Mars data. Both tools provide access to packaged and raw data, WFS links, and compatibility with ArcGIS and Google Earth. GeoMapApp offers marine geophysical and geochemical data access, while JMARS allows study of composite datasets from Mars missions with dynamic integration and 3D visualization. JMARS overlays MOLA altimetry and THEMIS imagery, permitting data tabulation and visualization. Explore various datasets and missions with visualization tools on both platforms.

GeoMapApp & JMARS: Geospatial Technology Tools for Ocean and Mars Data Visualization
E N D
Presentation Transcript
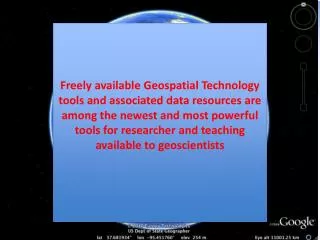
GeoMapAppTM A Java-based GIS and data visualization tool. Both "packaged” (i.e., global earthquake foci, volcanoes, bathymetry) and "raw" data (seismic surveys, magnetics, gravity) are accessible, along with WFS links to other resources, so one can fully characterize many regions of the ocean basins. Geospatially controlled data of all sorts can be imported into GeoMapApp, and GeoMapApp results can be ported to ArcGIS or Google Earth. Freely available Geospatial Technology tools and associated data resources are among the newest and most powerful tools for researcher and teaching available to geoscientists
GeoMapApp provides direct access to a range of marine geophysical and geochemical data – as well as WFS connections to geodetics (UNAVCO) and seismics (IRIS)
JMARS (jmars.asu.edu) maintained by the Mars Space Flight Facility at ASU, permits study of composite datasets from Viking, Mars Global Surveyor and Mars Odyssey missions, with links to original MOC, Viking, and THEMIS image strips. JMARS permits dynamic integration of datasets, permitting the recognition of phenomena not evident from any single source; and 3D visualization of altimetry and other data.
JMARS provides access to packaged datasets for different MARS imagery types, and for different missions. One can overlay multiple datasets and “fade” them in and out to highlight features of interest. You can also quickly obtain a tabulation of the raw image data for any region on the planet, for any recent mission. JMARS main window with Layer Manager. Overlays of MOLA altimetry, and THEMIS Daytime and Nighttime Infrared imagery. JMARS 3D viewer visualization of THEMIS Daytime Infrared imagery overlain on MOLA altimetry, 128 Zoom level.