SiC_measurement
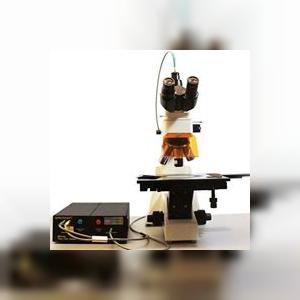
Semicon soft,Inc is the premier source of thin-film thickness measurement instrument . We are located in Southborough, MA USA. We offer various measurement instruments like thin film measurement system, optical spectroscopy , data analysis software etc. Our solution are available for a variety of applications, from desktop and to in-situ to in-line measurement.

SiC_measurement
E N D
Presentation Transcript
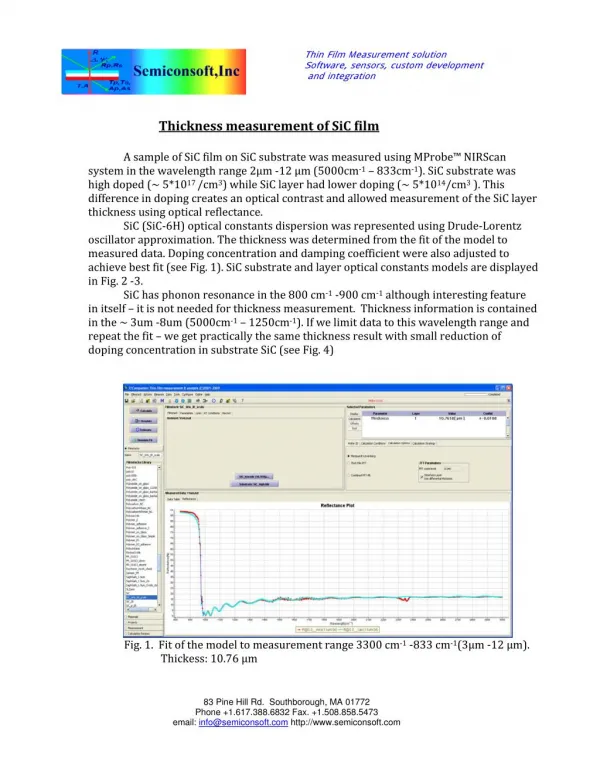
Thin Film Measurement solution Software, sensors, custom development and integration Thickness measurement of SiC film A sample of SiC film on SiC substrate was measured using MProbe™ NIRScan system in the wavelength range 2µm ‐12 µm (5000cm‐1 – 833cm‐1). SiC substrate was high doped (~ 5*1017 /cm3) while SiC layer had lower doping (~ 5*1014/cm3 ). This difference in doping creates an optical contrast and allowed measurement of the SiC layer thickness using optical reflectance. SiC (SiC‐6H) optical constants dispersion was represented using Drude‐Lorentz oscillator approximation. The thickness was determined from the fit of the model to measured data. Doping concentration and damping coefficient were also adjusted to achieve best fit (see Fig. 1). SiC substrate and layer optical constants models are displayed in Fig. 2 ‐3. SiC has phonon resonance in the 800 cm‐1 ‐900 cm‐1 although interesting feature in itself – it is not needed for thickness measurement. Thickness information is contained in the ~ 3um ‐8um (5000cm‐1 – 1250cm‐1). If we limit data to this wavelength range and repeat the fit – we get practically the same thickness result with small reduction of doping concentration in substrate SiC (see Fig. 4) Fig. 1. Fit of the model to measurement range 3300 cm‐1 ‐833 cm‐1(3μm ‐12 μm). Thickess: 10.76 µm 83 Pine Hill Rd. Southborough, MA 01772 Phone +1.617.388.6832 Fax. +1.508.858.5473 email: info@semiconsoft.com http://www.semiconsoft.com
Fig. 2. SiC substrate optical constants dispersion (Drude –Lorentz model) Fig. 3. SiC layer optical constants dispersion (Drude –Lorentz model) 83 Pine Hill Rd. Southborough, MA 01772 Phone +1.617.388.6832 Fax. +1.508.858.5473 email: info@semiconsoft.com http://www.semiconsoft.com
Fig. 4Fit of the model to measurement range 3300 cm‐1 ‐1250 cm‐1 (3μm ‐8 μm). Fig. 4Fit of the model to measurement range 3300 cm‐1 ‐1250 cm‐1 (3μm ‐8 μm). Thickess: 10.75 µm 83 Pine Hill Rd. Southborough, MA 01772 Phone +1.617.388.6832 Fax. +1.508.858.5473 email: info@semiconsoft.com http://www.semiconsoft.com