Download
1 / 2
20 likes | 130 Views
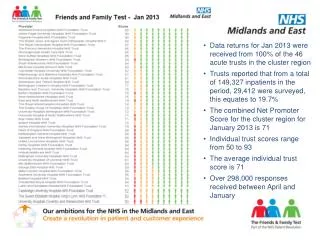
Data returns for Jan 2013 were received from 100% of the 46 acute trusts in the cluster region Trusts reported that from a total of 149,327 inpatients in the period, 29,412 were surveyed, this equates to 19.7%

E N D
Data returns for Jan 2013 were received from 100% of the 46 acute trusts in the cluster region • Trusts reported that from a total of 149,327 inpatients in the period, 29,412 were surveyed, this equates to 19.7% • The combined Net Promoter Score for the cluster region for January 2013 is 71 • Individual trust scores range from 50 to 93 • The average individual trust score is 71 • Over 298,000 responses received between April and January
Friends & Family Test Scores by Week: January 2013 • Above chart shows January NPS by week for the top 5 performing trusts • The greatest fluctuation is 18 points week on week, highlighting the need to constantly monitor scores. It is to be noted that fluctuations will be more noticeable on a week by week basis, taking into account the smaller sample size.