Download
1 / 35
350 likes | 430 Views
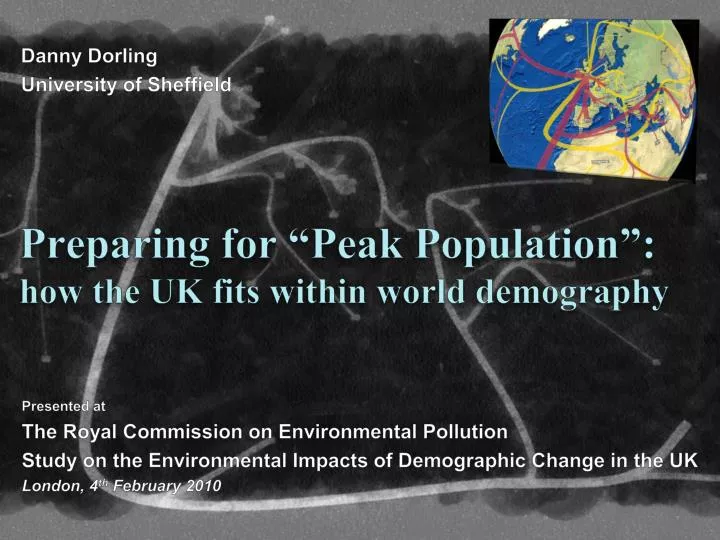
Danny Dorling University of Sheffield. Preparing for “Peak Population”: how the UK fits within world demography. Presented at The Royal Commission on Environmental Pollution Study on the Environmental Impacts of Demographic Change in the UK London, 4 th February 2010.

E N D
Danny Dorling University of Sheffield Preparing for “Peak Population”:how the UK fits within world demography Presented at The Royal Commission on Environmental Pollution Study on the Environmental Impacts of Demographic Change in the UK London, 4th February 2010 There is much talk of ‘peak oil’ and ‘environmental pollution’, but almost nothing said of ‘peak population’.
Population Trends The map that is in the background to these slides shows population movements from the United Kingdom of those currently alive.
Year 0 Go back in time 2000 years and this is how human beings were distributed globally. Here area is drawn in proportion to population.
Year 1500 500 years ago almost none of these countries existed. Note how large Africa was before mass slavery.
Year 1900 One hundred years ago European population peaked, 24 years after condoms were widely publicised.
Year 1960 Fifty years ago the contraceptive pill was first used in affluent countries. Everywhere population growth was slowing.
Year 2002 Eight years ago a majority of people in the world were living in countries with below-replacement fertility.
Year 2050 In just over forty years time the world population is predicted by the UN to start declining. This is where people will be then.
Year 2300 Africa continues to grow until 2300 while worldwide population falls according to the UN central projections.
Shrinking Europe For the first time since plague world population is about to shrink: So it does quickly in Europe
Year 1900: Wealth and Condoms Population Peak in Europe: Falling fertility since 1877 This is how people were distributed in Europe when population growth was highest, and began to slow
Year 1960: The Pill Final baby boom The 1960s baby boom, the children of the 1946 boom, the grandchildren of the 1919 boom, are the last.
Year 2002: Nowadays Diminishing Europe... Today Europe relies on immigration to maintain population, services and its plurality.
Year 2050: World Peak Population ...and expanding Africa Even with continued immigration at current levels Europe will shrink in its global population share
Year 2300: Furthest Predictions Global Stability It is a waste of built infrastructure to plan for Europe to shrink. The future will probably look very different to this.
Ageing Britain in 2010 The United Kingdom is currently home to 1% of the world’s adults but only half a percent of children.
A Children’s World Map of the World’s Children There are two billion children in the world – these are future carers of the old
An aged World Map of the 100 year olds The very oldest people are concentrated in just a few of the richest countries – often those with the least children
Population Movements Future population balance will depend primarily on population migration.
International Immigrants This maps shows where all the people who have crossed international borders since birth now live.
International Emigrants This map shows where all the people who have crossed international borders since birth were born.
Net Immigration This map shows how many extra people those countries which gain from migration receive.
Net Emigration This map shows how many people those countries which lose population are losing.
Population patterns in the united kingdom Each country in the world experiences a different story that reflects its history
Where they are The world’s ‘real’ population distribution Within each country people concentrate in particular areas and are leaving other parts
Where they are UK’s ‘real’ population distribution Within the United Kingdom in recent decades population growth has been constrained to the south of England.
High density living is rare Administrative extent of major urban areas in Britain Only eight urban areas in Great Britain are substantially built up at much lower density than most major European cities
Sprawl:Encouragedbyinfrastructure Major road network in Britain Lack of investment in rail and too much motorway building has increased social polarised urban sprawl
Southern population concentration Bankers in Britain The spatial concentration of a bloated finance industry skewed population growth towards the south in England as well as Wales and Scotland.
Areas currently losing out in Britain Labour votes at the 2005 general election The places that lost out most in recent years in terms of wealth, health, population influx and now (un)employment were those in the north and in inner cities.
Born abroad 7.5% of people living in Britain were born abroad Parts of Britain are now home to one of the most diverse pluralities of people in Europe. http://news.bbc.co.uk/1/shared/spl/hi/uk/05/born_abroad/html/overview.stm
Going abroad More than 400,000 people left the UK in 2007 In equal number to those arriving, Britains move abroad. People leave in greater numbers during recessions.
Migration Patterns Migration flows from and to the United Kingdom in 2006 Emigrants from the UK Immigrants to the UK The environmental impact of emigrants is much greater than immigrants – in total.
The United Kingdom A crossroad in the world’s demographic change Among the countries in Europe, the United Kingdom currently has fewer residents born abroad than Austria, Belgium, France, Germany, the Netherlands, Sweden and Switzerland – and also fewer than Canada, the USA, Australia and New Zealand.
Credits “Now, for the first time in human history, a majority of people worldwide can read what you write. Some five out of every six children in the world are now taught to read and write to a degree that only a minority of their parents were; a majority of their children will probably have internet access. A hundred million young adults worldwide are now allowed to study in the hallowed halls of universities each year. Education may still be hugely unjust in how it is distributed and may be in some ways becoming more unjustly allocated, but there are many more people alive in the world today who have been given the freedom to learn right through to college. This is not just many more than before, it is many more than all those before combined; more humans alive today have been to university than all the human beings who have ever gone. The forebears of today’s university graduates almost all became part of a tiny elite, in some way governing others and being rewarded with riches as a result. Only a very small minority of today’s university graduates can become rich; there are simply far too many now for all but a tiny fraction to be very wealthy, or to have much power, or both. Why should we expect the rest to accept this situation placidly? Fortunately, and far from coincidently, human population growth is peaking at exactly the same time as our literacy and understanding explodes. It is not hard to be pessimistic, but it is also not hard to be an optimist too given the circumstances we now find ourselves in.” (From Daniel Dorling: "Injustice: why social inequality persists, Bristol: Policy Press, April 2010“) • Slideshow based on a talk given by Danny Dorling atThe Royal Commission on Environmental Pollution Study on the Environmental Impacts of Demographic Change in the UK • All maps created by the Worldmapper team, most of which can be found online at www.worldmapper.org • Slides created by Benjamin Hennig Further reading suggestions: Magnason, A. S. (2008). Dreamland: A Self-Help Manual for a Frightened Nation.London, Citizen Press Ltd. http://www.dustormagic.net/EqualityWhen/SocialBarriersToSustainability.html http://www.dustormagic.net/NOII/TooManyOfWhomJan10.html http://www.guardian.co.uk/environment/georgemonbiot/2009/apr/20/food-carbon-emissions http://www.guardian.co.uk/world/2010/feb/01/population-crash-fred-pearce