Download
1 / 21
210 likes | 322 Views
This resource provides a series of exercises designed to enhance your understanding of key statistical concepts such as mean, median, mode, and range using given data sets. Learn how to calculate these statistics, manipulate the datasets, and understand how changes affect the overall results. Additionally, explore frequency distribution tables and interval frequency tables to organize and analyze data effectively. Ideal for students and anyone interested in statistics.

E N D
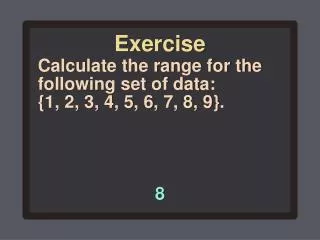
Exercise Calculate the range for the following set of data: {1, 2, 3, 4, 5, 6, 7, 8, 9}. 8
Exercise Calculate the median for the following set of data: {1, 2, 3, 4, 5, 6, 7, 8, 9}. 5
Exercise Calculate the mean for the following set of data: {1, 2, 3, 4, 5, 6, 7, 8, 9}. 5
Exercise Calculate the mode for the following set of data: {1, 2, 3, 4, 5, 6, 7, 8, 9}. none
Exercise Which of these statistics would change if you added 5 to each piece of data? The median and mean,which would be 5 more.
92 88 96 100 76 88 96 72 84 80 68 76 88 88 86 76100 80 72 92 88 96 80 84
Frequency Distribution Table A table used to organize a large set of data.
Frequency Distribution Table Data (D) Tally Frequency (f) Product (Df)
Data Column The data column of the frequency distribution table contains the data arranged in numerical order.
Frequency Column The frequency column of the frequency distribution table represents the number of times each number occurs (number of tallies). The number at the bottom of the column is the total number of data.
Product Column The product column of the frequency distribution table is the product of the numbers in the data column (D) and the frequency column (f). The number at the bottom of the column is the sum of all data.
Example Find the range, mean, median, and mode for Mrs. Koontz’s students’ test scores.
2,04624 product total = mean: frequency total range: 100 – 68 = 32 ≈ 85.3
1742 86 + 882 = median: twelfth score: 86 thirteenth score: 88 = 87 mode: 88
Interval Frequency Table Age (interval) Frequency (f) 10–19 14 20–29 10 30–39 17 40–49 8 50–59 15 60–69 12 70–79 5 80–89 2
Histogram A histogram is a bar graph representing equal intervals, with no space between the bars.
Number of People Age
Age (interval) Midpoint (m) Frequency (f) Product (mf) 14.5 10–19 14 203 24.5 20–29 10 245 34.5 30–39 17 586.5 44.5 40–49 8 356 54.5 50–59 15 817.5 64.5 60–69 12 774 74.5 70–79 5 372.5 84.5 80–89 2 169 Total 83 3,523.5
Example The following are a set of scores on a twenty-five-point quiz: {17, 24, 19, 22, 23, 12, 24, 25, 25, 13, 18, 22, 24, 23, 22, 20, 18}.
Example The following numbers are the test scores: {60, 62, 68, 68, 69, 69, 70, 77, 78, 78, 78, 79, 79, 80, 80, 80, 81, 82, 82, 82, 83, 83, 83, 83, 83, 85, 89, 90, 91, 92, 92, 93, 93, 95, 99}.
Product (mf) Midpoint (m) Frequency (f) Interval

![[Exercise Name] Functional Exercise](https://cdn0.slideserve.com/621913/exercise-name-functional-exercise-dt.jpg)

![[Exercise Name] Functional Exercise](https://cdn1.slideserve.com/1717560/exercise-name-functional-exercise-dt.jpg)


![[Exercise Name] Functional Exercise](https://cdn3.slideserve.com/6680259/exercise-name-functional-exercise-dt.jpg)
![[Exercise Name] Tabletop Exercise](https://cdn4.slideserve.com/9191716/exercise-name-tabletop-exercise-dt.jpg)