Download

1 / 18
180 likes | 356 Views
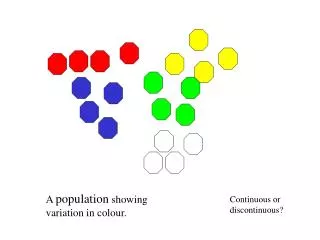
Continuous and discontinuous variation Genes in population. Discontinuous Variation. The phenotypes we have consider so far have been due to two segregating alleles of single genes. This means that alternative phenotypes are clearly different.

E N D
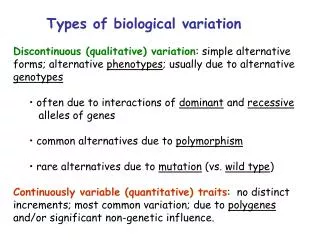
Discontinuous Variation • The phenotypes we have consider so far have been due to two segregating alleles of single genes. • This means that alternative phenotypes are clearly different. • This variation or difference between phenotypes is known as discontinuous variation.
Continuous Variation • Many phenotypes show continuous variation – there are many intermediate forms and the distribution of the phenotypes in a population is a bell curve. • Traits that show continuous variation include: height and weight in humans, milk production in cows and the size of flowers. • Continuous traits are usually polygenic, with alleles of many different genes contributing to produce the final phenotype. • This results in considerable phenotypic variation, and further variation may also occur due to interactions with the environment.
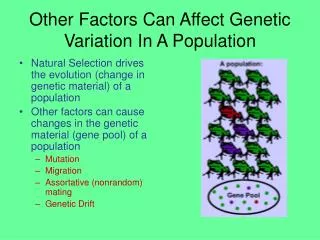
Variation in Phenotype • Variation in phenotype in populations is influenced by the following factors: • One gene can have many alleles • Meiosis involves independent assortment and genetic recombination of alleles • Dominance may not be complete • Several genes can affect the one trait • One gene can determine more than one trait • The expression of genes can be affected by other genes and by the environment
Genes in populations • Different people in same community have different risks for disease. • The reasons for this are a complex mix of genetic, environmental and social risk factors. • Epidemiology is the description and analysis of the pattern of diseases in the population, the causes of these different patterns, and the use of this information to improve public health. • We know that some diseases, both rare and common, seem to ‘run in families’. • Genetic epidemiology attempts to determine the size of genetic influences on disease.
Heterozygote Advantage • Some extremely serious and often fatal genetic diseases continue to be present in the population but why???? • If individuals who are homozygous for such a disease normally die before reproducing, we would expect natural selection to lead to low frequencies for the disease allele in the population. • This is not always the case – take the sickle cell anaemia gene and the cystic fibrosis gene as examples.
Heterozygote Advantage:Sickle Cell Anaemia • High frequency of the mutant allele in people of African descent • Homozygotes suffer from life-threatening anaemia • The explanation for the unexpected frequency is that being heterozygous for this allele is advantageous in areas where malaria is present. • The mutant allele results in defective haemoglobin molecules alter the red blood cells so that they are less susceptible to infection by the malarial parasite.
Heterozygote Advantage:Cystic Fibrosis • High frequency of the mutant allele in people of Caucasian background (1 in 28 Caucasians are heterozygotes) • Mutant copy of CFTR gene leads to defective channel proteins being produced in the cell membrane • The bacteria Salmonella typhi requires the channel protein in order to get across the intestine wall • This means that heterozygotes are less susceptible to typhoid fever • The gene frequencies currently observed are a result of previous heterozygote advantage when typhoid fever was widespread in Europe
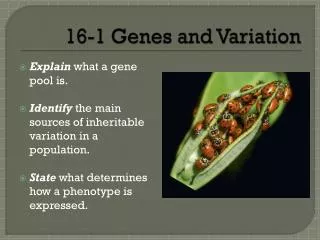
What is the gene pool • The genetic information in an individual is a genotype. • The genetic information in a population is a gene pool. • A gene pool is described in terms of the allele frequencies (proportions) of each gene. • When genotypes of all members of a population are known, allele frequencies may be calculated directly from genotype frequencies. • When allele frequencies are not known, they may be estimated starting from the frequency of the homozygous recessive phenotype.
Calculating Allele Frequencies • Looking at this picture, the 10 sheep comprises two black (genotype ww), two heterozygous white (genotype Ww) and six homozygous white (genotype WW) sheep. • Each sheep has two alleles, and so the total number of alleles of this gene is twice the number of organisms in the population. • In this population: • total number of alleles = 10 × 2 = 20 • number of W alleles = (6 × 2) + 2 = 14 • number of w alleles = (2 × 2) + 2 = 6 • Frequency of W alleles or freq (W) = 14/20 = 0.7 • Frequency of w alleles or freq (w) = 6/20 = 0.3 • The allele frequencies total 1.0, so we can write: freq (W) + freq (w) = 1.
Calculating Allele Frequencies • This means that, if the frequency of one allele only is given, the frequency of the second allele can be obtained by subtracting the given frequency from one: • freq (W) = 1 − freq (w) • freq (w) = 1 − freq (W). • A convention exists whereby the frequency of the allele controlling the dominant trait is denoted by the letter p, and the frequency of the allele controlling the recessive trait is denoted by the letter q. So, we can write: • p + q = 1 • p = 1 − q • q = 1 − p.
Calculating Allele Frequencies • It is only when all genotypes in a population can be identified with certainty that the allele frequencies in the gene pool can be calculated directly. • This occurs when there is a co-dominant relationship between two alleles. • In reality we could not directly calculate the allele frequencies in the sheep population on the previous slide as we cannot tell the difference between homozygotes and heterozygotes with a white phenotype. • When genotypes of all individuals are not known, the allele frequencies in that population cannot be calculated directly. However, under certain conditions, allele frequencies can be estimated using the Hardy-Weinberg equilibrium equation.
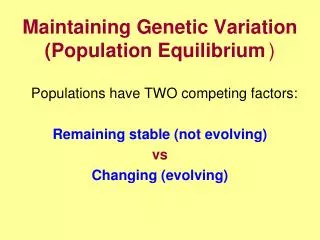
Hardy-Weinberg Principle • Allele frequencies in populations remain constant, generation after generation, provided a particular set of conditions apply. • Conditions include: • The population must be large. • Members of the population mate at random; random mating contrasts with non-random or assortative mating in which matings are restricted to those between organisms of like phenotypes. • All matings are equally fertile, producing equal numbers of viable offspring. • The population is closed, with no migration either into or out of the population. • Under these conditions, the allele frequencies in a large closed population will remain constant from generation to generation. Such a population is said to be in Hardy–Weinberg equilibrium (H–W equilibrium). • The situation will remain like this until an agent of change acts on the population.
Hardy-Weinberg Equation • The Hardy-Weinberg equilibrium equation was derived to calculate the frequency of alleles in a population. • If p is defined as the frequency of the dominant allele and q as the frequency of the recessive allele for a trait controlled by a pair of alleles (A and a) the following equation applies: (p + q)² = 1 or more simply p² + 2pq + q² = 1 • In this equation: • p² is the predicted frequency of homozygous dominant (AA) people in a population • 2pq is the predicted frequency of heterozygous (Aa) people • q² is the predicted frequency of homozygous recessive (aa) ones.
Hardy-Weinberg Equation • From observations of phenotypes, it is usually only possible to know the frequency of homozygous recessive people, or q² in the equation. • Since p = 1 - q and q is known, it is possible to calculate p as well. • Knowing p and q, it is a simple matter to plug these values into the Hardy-Weinberg equation (p² + 2pq + q² = 1). • This then provides the predicted frequencies of all three genotypes for the selected trait within the population.
Albinism is a rare genetically inherited trait that is only expressed in the phenotype of homozygous recessive individuals (aa). The most characteristic symptom is a marked deficiency in the skin and hair pigment melanin. This condition can occur among any human group as well as among other animal species. The average human frequency of albinism in North America is only about 1 in 20,000. Based on the Hardy-Weinberg calculation on the next slide, we can determine the following: Albinos will be found with a frequency of 0.005% Heterozygous carriers for this trait have a predicted frequency of 1.4% (about 1 in 72) Vast majority of humans (98.6%) probably are homozygous dominant and do not have the albinism allele. Example of Hardy-Weinberg equation in action
Hardy-Weinberg equation (p² + 2pq + q² = 1) Frequency of homozygous recessive individuals (aa) in a population is q². The following must be true for albinism: q² = 1/20,000 = .00005 q = .007 p = 1 - qp = 1 - .007p = .993 p² + 2pq + q² = 1(.993)² + 2 (.993)(.007) + (.007)² = 1.986 + .014 + .00005 = 1 This gives us the frequencies for each of the three genotypes for this trait in the population: p² = predicted frequencyof homozygous dominant individuals = .986 = 98.6% 2pq =predicted frequency of heterozygous individuals = .014 = 1.4% q² =predicted frequency of homozygous recessive individuals = .00005 = .005% Example of Hardy-Weinberg equation in action