Unemployment
350 likes | 649 Views
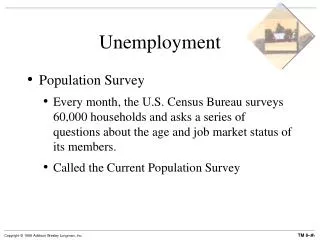
Unemployment. A measure of wasted resources…. Measuring Unemployment Since 1940. Unemployment is measured by the Bureau of Labor Statistics (BLS) part of the Department of Labor. Data is compiled from monthly surveys (60,000 households) Current Population Survey

Unemployment
E N D
Presentation Transcript
Unemployment A measure of wasted resources… (c) 2002 Claudia Garcia-Szekely
Measuring Unemployment Since 1940. • Unemployment is measured by the Bureau of Labor Statistics (BLS) part of the Department of Labor. • Data is compiled from monthly surveys (60,000 households) • Current Population Survey • Data does not come from unemployment insurance (UI) records… • UI is one of many factors used. (c) 2002 Claudia Garcia-Szekely
Basic Concepts • If you have a job, you are employed • If you do not have a job but you are available and looking for work, you are unemployed. • If you are neither employed nor available and looking for a job you are not in the labor force. (c) 2002 Claudia Garcia-Szekely
Employed • Full time, part time and temporary work… • Worked at least ONE hour or more forpay or profit during the survey week. • Worked 15 hours or more without pay in a family business. • Temporarily absent from work • Illness, vacation, labor dispute, etc. (c) 2002 Claudia Garcia-Szekely
Unemployed • Do not have a job. • Available for work. • Made specific efforts to find a a job during the previous four weeks. • Not working, waiting to be called back to a job from which they were temporarily laid off. (c) 2002 Claudia Garcia-Szekely
Not in the Labor Force • Those who have no job and are not looking for a job. • Retired • Full time students • Home makers. • Volunteers • Institutional Population. • Mental Institutions • Prison • Military (c) 2002 Claudia Garcia-Szekely
Active Population > 16 years AP = LF + NLF Not in Labor Force Labor Force 85 million 162 million (c) 2002 Claudia Garcia-Szekely
Labor Force LF = E + U Unemployed Employed (c) 2002 Claudia Garcia-Szekely
Growth in population and labor force, 1994-2004 and projected 2004-14 Population and labor force, 1994, 2004, and projected 2014
FORMULAS Unemployed Unemployment Rate (Ur) X 100 = Labor Force Labor Force Labor Force Participation Rate X 100 = Active Population (c) 2002 Claudia Garcia-Szekely
Is Unemployment Measured Correctly? No. There are three problems with this statistic: • Underemployment • The Discouraged Worker Effect • The treatment of part time work as full time. (c) 2002 Claudia Garcia-Szekely
Discouraged Workers are not in the Labor Force. A discouraged worker is someone who gave up looking for a job. • They are NOT counted as unemployed but should because they are part of the active population, and would work if a job was available. (c) 2002 Claudia Garcia-Szekely
Example LF =_____ Ur =_____ Unemployed 5,000 Employed 95,000 (c) 2002 Claudia Garcia-Szekely
Unemployed 5,000 Employed 95,000 1,000 give up looking for work When workers lose all hope of finding a job Unemployment rate decreases! Unemployed 4,000 LF =99,000 4.04% Ur =_____ Employed 95,000 95,000 4,000 LF = 100,000 95,000 5,000 5% Ur =_____ (c) 2002 Claudia Garcia-Szekely
Discouraged Worker Effect. • An increase in the number of discouraged workers shows up as a decrease in the unemployment rate! • During long recessions, more workers become discouraged reducing the Ur. During recessions true unemployment is underestimated (c) 2002 Claudia Garcia-Szekely
Part Time Workers counted as Employed • Including those who worked only one hour/week • These individuals would work full time if a job was available… • They should be counted –at least partially- as unemployed. (c) 2002 Claudia Garcia-Szekely
Underemployed workers counted as Employed A person working on a job that does not use his/her full potential is Underemployed • A computer programmer delivering pizzas. • Underemployed individuals are counted as employed even though their skills are unemployed. • There are no official statistics on underemployment: • Difficult to develop objective criteria. • Difficult to quantify loss to society. (c) 2002 Claudia Garcia-Szekely
The Unemployment Rate:Three Misrepresentations Not Unemployed Discouraged Workers Underestimate true Unemployment Counted as employed Part Time Workers Inflate Number employed Underestimate true Unemployment Under-employed Workers Counted as employed (c) 2002 Claudia Garcia-Szekely
Unemployment is never ZERO Even when the economy is growing at its “potential” there will be some workers unemployed. (c) 2002 Claudia Garcia-Szekely
Three types of unemployment: • Structural: workers who do not have the necessary skills…there is no job for them. • Frictional: workers with the necessary skills but have not found their job yet. • Cyclical: workers with the necessary skills for the job, but lack of demand prevents firms from hiring them. (c) 2002 Claudia Garcia-Szekely
The Full Employment Rate of Unemployment: Natural Rate At full employment • Unemployment is NOT zero. • CYCLICAL unemployment is zero. But at full employment • There is still frictional and structural unemployment. (c) 2002 Claudia Garcia-Szekely
Frictional 4% Structural 1% Three components to Unemployment Natural Rate of Unemployment 5% Ur=6% Between Jobs 4% Frictional 4% Unemployed due to recession 1% Cyclical 1% Recession Ends Unemployed due to lack of skills 1% Structural 1% Zero Cyclical Unemployment (c) 2002 Claudia Garcia-Szekely
The Natural Rate of Unemployment Natural Rate of Unemployment was estimated between 5 and 6%. Frictional Structural Natural + = (c) 2002 Claudia Garcia-Szekely
The Cost of Unemployment: Unemployment Increases Inequality When the Ur for white Men rises by 1%, the Unemployment rate for Unemployment increases inequality: When the national unemployment rate rises, the unemployment rate of the most disadvantaged groups rise faster. “When the economy catches a cold minorities and young people get pneumonia” Alan Blinder Rises by:
The Cost of UnemploymentLost Output: Okun’s Law An extra percentage point of unemployment above the natural rate corresponds to an output gap of 2.5 percentage points of GDP. An extra 1% of unemployment represents a loss of output equal to 2.5% of GDP = 11,398*0.025=285 Billion worth of goods and services (c) 2002 Claudia Garcia-Szekely
Questions to prepare for quiz • Do you believe the official rate of unemployment overstates or understates the seriousness of unemployment? Why? • Why is there unemployment? Provide at least two reasons for unemployment to exist. That is, explain why the unemployment rate is never zero? • Define and explain the Natural Rate of Unemployment? (c) 2002 Claudia Garcia-Szekely
Suppose that the active population is 230 million, the labor force participation rate is 66% and the unemployment rate is 5%. If the number of discouraged workers increases by 5 million, what does the unemployment rate become? Active population is 30 million, labor force participation rate 60%, number of discouraged workers 2 million, number of people with full time jobs 13 million, number of people with part time jobs is 2 million. Calculate the unemployment rate.
Suppose that GDP is 11,000 billion and current unemployment is 7%. What would GDP be if unemployment were only 3%? Hint: use Okun’s Law. Why the lowest unemployment is no longer 5%? Does the existence of unemployment insurance eliminate the economic costs of unemployment? (c) 2002 Claudia Garcia-Szekely