Download
1 / 29
290 likes | 508 Views
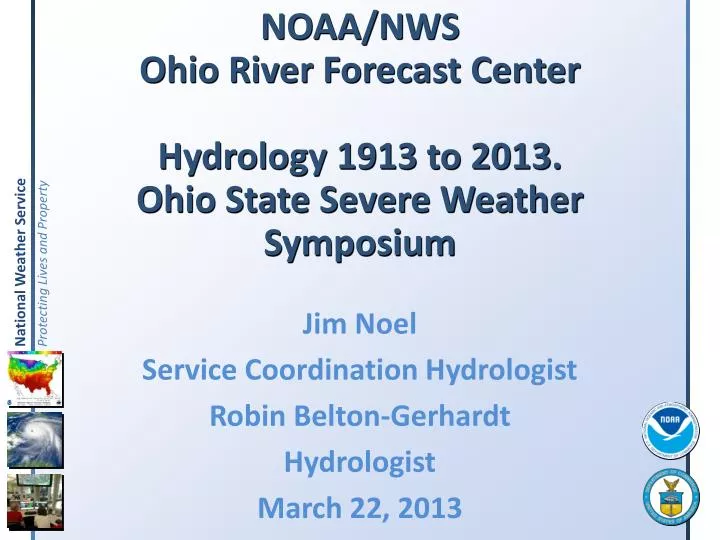
NOAA/NWS Ohio River Forecast Center Hydrology 1913 to 2013. Ohio State Severe Weather Symposium. Jim Noel Service Coordination Hydrologist Robin Belton-Gerhardt Hydrologist March 22, 2013. Outline. Hydrology of 1913 Duration of 1913 flood Magnitude of 1913 flood

E N D
NOAA/NWSOhio River Forecast CenterHydrology 1913 to 2013.Ohio State Severe Weather Symposium Jim Noel Service Coordination Hydrologist Robin Belton-Gerhardt Hydrologist March 22, 2013
Outline • Hydrology of 1913 • Duration of 1913 flood • Magnitude of 1913 flood • Big floods in the Ohio Valley • 1913 in 2013 • 1913, 1997 and 2010 in 2013 • Today’s Advances in Hydrology
Hydrology of 1913 • There was no snowpack prior to the event • Soil conditions were wet leading into the event • Streamflow conditions were not really elevated • 1913 was an extreme event but also had a lot of classic historic event characteristics • Most of the intense rain fell in a few days • Runoff rates were very high, close to 1, complete runoff • Rivers responded fast to the runoff • Systems failed as Mother Nature exceeded the capabilities of the system (both natural and man-made)
Hydrology of 1913 • River gages where 1913 flood of record still stands.
Duration of Flooding from 1913 • Flood happened fast in the faster responding upper Ohio River and Great Lakes basins. Legend Days Above Flood Stage 1-3 3-10 10-20 20-30 >30
Magnitude of Flooding from 1913 • Minor flooding begins to appear in northern Ohio ahead of the main storm
Magnitude of Flooding from 1913 • Flood expands across northern Indiana to northern Ohio and western Pennsylvania in faster responding areas.
Magnitude of Flooding from 1913 • Significant flooding occurring rapidly in faster responding tributaries
Magnitude of Flooding from 1913 • Widespread major flooding is occurring across the northern Ohio Valley into the Lake Erie drainage areas
Magnitude of Flooding from 1913 • Significant flooding subsiding in upstream tributaries but continues in downstream tributaries into Ohio River.
Magnitude of Flooding from 1913 • Flooding is shifting from the fast responding to slower responding rivers by March 28, 2013
Magnitude of Flooding from 1913 • Flooding now focused on lower Wabash, lower White basins of Indiana into Ohio River.
Magnitude of Flooding from 1913 • By April 1 the flood is now mainly in the Ohio River and heading downstream. It usually takes about a week for the water to move down the Ohio River.
Big floods in the Ohio Valley • Big floods are common in the Ohio Valley • Do these sound familiar: 1913, 1927, 1937, 1959, 1964, 1997, 2005, 2008, 2010, 2011 to name a few. Many more. Next one is 201? • Why? Crossroads of the jet stream. • Ohio River Forecast Center is one of the busiest in the country, usually in top three of 13 RFCs. • Flooding occurs in most months of the year. • Most big floods have a similar look! • Most meteorologists and hydrologists focus on the 500 mb trough. However, OHRFC research suggests the Southeast Ridge is even more important – like a ball hitting a wall!
Big floods in the Ohio Valley 1913 500 hPa 1997 500 hPa ATL= 585 ATL= 585 2010 500 hPa Composite ATL= 582 ATL= 585
1913 flood in 2013 • Youngstown, Ohio crest would be lower and faster with local water getting in faster. Also, Army Corps of Engineers holds water in their projects and release later for longer recession.
1913 flood in 2013 • Zanesville, Ohio crest would be substantially lower as upstream projects of the Army Corps of Engineers and Muskingum Conservancy District hold water and release later for longer recession.
1913 flood in 2013 • Columbus, Ohio crest would be similar or possibly slightly higher. However, due to levee failures (1913) and other complexities, confidence is low at this point.
1913 flood in 2013 • Dayton, Ohio crest would be substantially lower as upstream projects of the Miami Conservancy District hold water and release later for longer recession. Flood Stage would not occur.
1913 flood in 2013 • Fort Wayne, Indiana crest would be slightly higher and later with faster recession. This is likely a combination of urbanization and water getting into system faster.
1913 flood in 2013 • Terre Haute, Indiana crest would be lower and faster with similar recession. Local water gets into system slightly faster. Much of the landscape remains agriculture over this time.
1913 flood in 2013 • Indianapolis, Indiana crest would be lower with double crest from local water, then upstream water arriving. Urbanization is responsible for initial crest. Recession is slower.
1913, 1997 and 2010 flood in 2013 • So, can we have worse floods in terms of rainfall than the 1913 flood? • Answer is YES! • If so, what would some other recent floods, such as the 1997 Kentucky flood and 2010 Nashville flood, look like today? 1913 8-10+ inches 1997 9-11+ inches 2010 10-15+ inches
1913, 1997 and 2010 flood in 2013 • Columbus, Ohio – Convective extreme events such as the 2010 event in Nashville of up to 15+” of rain would cause extreme rises. Exact crests would be driven by how the system can maintain itself. Crests likely lower than shown here because things could fail.
1913, 1997 and 2010 flood in 2013 • Dayton, Ohio – Flooding would be far less than in 1913 due to the impressive system built. 1913 today would be similar to 1997 today with 2010 being a more impressive system, but still well below 1913.
Today’s Advances in Hydrology • Flood systems are in place, as in parts of the Miami and Muskingum systems. • Awareness is much better. • Forecasting is now available with decent lead times. • River modeling continues to improve. • Ensemble and probabilistic forecasting are advancing. • Flood mapping is expanding. • Hydrology is in the rapid growth period much like meteorology was in 1985.
Today’s Advances in Hydrology • River Ensemble Forecasting System http://www.erh.noaa.gov/mmefs
Today’s Advances in Hydrology • River Ensemble Forecasting System http://www.erh.noaa.gov/mmefs
Questions! • James.Noel@noaa.gov NOAA/NWS/OHRFC Service Coordination Hydrologist THANKS!