Download
1 / 18
180 likes | 291 Views
Biology Review Ch 15. Populations Review. A population consists of all the individuals of a species that Live together in one place At one time Every population tends to grow because individuals tend to have “multiple offspring” over their lifetime.

E N D
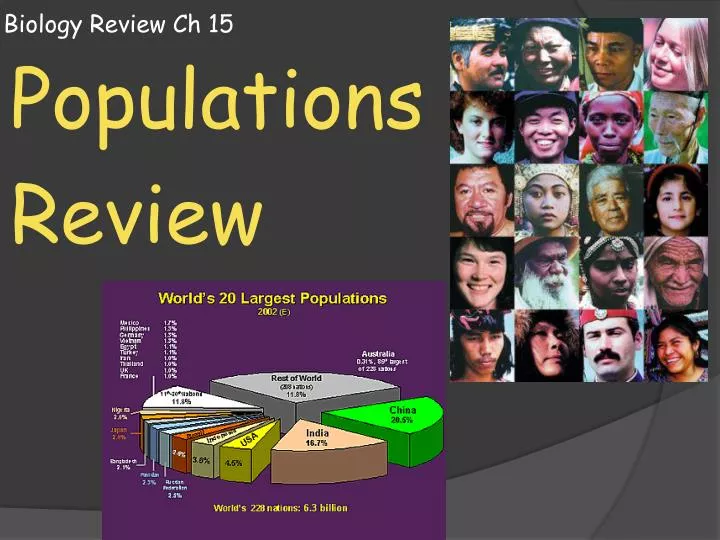
Biology Review Ch 15 Populations Review
A population consists of all the individuals of a species that • Live together in one place • At one time • Every population tends to grow because individuals tend to have “multiple offspring” over their lifetime. • Eventually, limited resources in a community limit the growth of a population. Not enough food, water, shelter or medicine will hold down the population growth. • The statistical study of all populations is called demography. Demographersstudy the composition of a population; the demographics, and try to predict how the size of the population will change.
One of the most important features of any population is it’s size. The number of individuals in a population, the population size, can affect the population’s ability to survive. • Studies have shown that very small populations are the most likely to become extinct. Random events; such as a fire or flood, endanger small populations more than they endanger larger populations. • Small populations also tend to experience more inbreeding (breeding with relatives) than larger populations because only relatives are available. Inbreeding produces a more genetically identical (less diverse) population and is therefore likely to reduce the population’s fitness. • A second important feature is it’s density. Population density is the number of individuals that live in a given area. If the individuals of a population are few and spaced far apart, they may seldom meet each other, making reproduction of the species a rare event.
The third feature of a population is the way the individuals are arranged in space. This feature is called dispersion. Three main patterns of dispersion are possible within a population. • Regularly spaced individuals have an even spacing between them, equal distances from each other. • Randomly spaced individuals have a spacing determined by chance. • Clumped individuals are in bunches or clusters, located in groupings close to each other. • When demographers want to predict how a population will grow, they make a model of the population. A population model is a hypothetical population that attempts to exhibit the key characteristics of a “real” population. By making a change in the model, and observing the outcome, demographers might predict what might happen in a real population.
Growth rate: A population grows when more individuals are born than die in a given period. A simple population model describes the rate of population growth as the difference between the birth rate and the death rate. • When population growth is plotted against time on a graph, the population growth curve resembles a J-shaped curve and is called an exponential growth curve. An exponential growth curve is a curve in which the rate of population growth stays the same. As a result, the population growth increases steadily in an unrestricted growth. • Figure (a) at left shows an exponential growth curve. A single bacteria cell that divides every thirty minutes will produce more than 1 million bacteria after only 10 hours. Every thirty minutes the population doubles. However, most populations do not grow unchecked. Their growth is limited by predators, disease, food supply and availability of other resources. Eventually growth slows and a population stabilizes. The population size that an environment can sustain is called the carrying capacity.
As a population grows, resources such as food supply eventually become depleted. Their may not be enough food supply to get all the animals through a winter in a given area. When this happens the rate of population acceleration slows. It has reached the point of maximum growth. • Resources such as food or water are called density-dependant factors because the rate at which they become depleted depends on the population density of the area.
The population model that takes into account the declining resources available to a population is called the logistic model of population growth. The logistic model of population growth is a population model in which exponential growth (constant doubling of the population) is limited by a density dependant factor (not enough food or water for example) • Many species of plants and insects reproduce quite rapidly. Their growth is limited not by density-dependant factors but by environmental conditions known as density-independant factors. Weather and climate are the most important density-dependant factors. For example, mosquito populations increase in the summer when it is warm but decrease in the winter when it becomes cold.
The growth of many bacteria, plants and insects is often described by an exponential growth model. The growth of slower growing organisms, such as humans and other mammals, is best described by a logistic growth model. Most species have a pattern of population growth somewhere between the two models. • Many species, including bacteria, some plants, and many insects, are found in rapidly changing environments. Such species, called r-strategists, grow exponentially when environmental conditions allow. This strategy allows temporarily large populations. When environmental conditions worsen, the population size drops quickly. In general, r-strategists have a short life span.
R-strategists reproduce early in life and have many offspring each time they reproduce. Their offspring are small, mature rapidly with little or no care from the parents. Mosquito populations are a prime example of an r-strategist species. • Organisms that grow slowly, such as whales, often have small population sizes. These species are called K-strategists because their population density is usually near the carrying capacity of their environment. • K-strategists are characterized by a long life span, few young, a slow maturing process, and reproduction later in life. K-strategists often provide extensive care for their young and tend to live in stable environments. Many endangered species such as tigers, gorillas, and whales are K-strategists.
When Mendel’s work was rediscovered in 1900, biologists began to study how the frequency of alleles changes in a population. Specifically, they wondered if the dominant alleles would replace recessive alleles in a population. Remember that alleles create the genotypes that affect which phenotypes, or traits, become visible in a population.
In 1908, GH Hardy and Wilhelm Weinberg independently demonstrated that dominant alleles do not automatically replace recessive alleles. Using algebra, and simple applications of the theories of probabilities, they proved that the frequency of alleles in a population does not change. • The ratio of heterozygous individuals(Bb)to homozygous (bb) individuals does not change from generation to generation unless the population is acted upon by processes that favor particular alleles. • Their discovery, called the Hardy-Weinberg Principal, states that the frequencies of alleles in a population do not change unless evolutionary forces act on the population.
The Hardy-Weinberg principal holds true for any population as long as the population is large enough that it’s members are not likely to mate with relatives and as long as evolutionary forces are not acting on it. • There are 5 principal evolutionary principals: Mutation, Gene flow, Nonrandom mating, Genetic drift, Natural selection Mutation: Although mutation from one allele to another can eventually change allele frequencies, mutation rates in nature are very slow. Most genes mutate only about 1 to 10 times per 100,000 cell divisions so mutation does not change allele frequencies except over very long periods of time. • Furthermore, not all mutations result in phonotype changes. Mutation is however, the source of variation and thus makes evolution possible.
Gene flow: The movement of individuals from one population to another can cause genetic damage. • The movement of individuals to or from a population, called migration, causes gene flow. Gene flow is the movement of alleles into or out of a population. Gene flow occurs because new individuals (immigrants) add alleles to the population and departing individuals (emigrants) take alleles away. Nonrandom mating: • Sometimes individuals prefer to mate with others that live nearby or are of their own phenotype, a situation called nonrandom mating. Mating with relatives (inbreeding) is a nonrandom mating that causes a lower frequency of heterozygotes than would be predicted by the Hardy-Weinberg principal. Inbreeding does not change the frequency of alleles, but it does increase the proportion of homozygotes (AA or aa genotypes) in a population. Genetic drift: • In small populations, the frequency of an allele can be greatly changed by a chance event. For example; poaching, disease or a fire can reduce a population to a few survivors. When an allele is found in only a few individuals, the loss of even one individual from the population can have major affects on the allele’s frequency. Because this sort of change, an allele frequency appears to occur randomly, as if the frequency was drifting, it is called genetic drift.
Natural Selection : Natural selection causes deviations from the Hardy-Weinberg proportions by directly changing the frequency of the alleles. • The frequency of an allele will increase or decrease depending on the allele’s effects on survival and reproduction. • If an allele makes a species less visible to a predator, than it’s survival chance will go up and the allele will increase in the population. • Conversely, if an allele makes a species more visible to a predator, it’s survival chance will go down and the allele will decrease as the species will not survive to pass it on. • Natural selection constantly changes populations through actions on individuals within the population. It does act directly on genes. It enables individuals who have favorable traits to reproduce and pass on those traits to their offspring. Think carefully how natural selection might operate on an allele mutation. • Only characteristics that are expressed can be targets of natural selection. Therefore, selection can not operate against rare recessive genes, even if they are unfavorable. Only when an allele becomes common enough that heterozygous individuals come together and produce homozygous offspring, does natural selection have an opportunity to act.
Why Genes Persist: To better understand this limitation on natural selection, consider this example. • If a recessive allele (a) is homozygous (aa) in 1 out of 100 individuals, (appearing visibly in only 1 person) and if 18 out of 100 individuals will be heterozygous (Aa) (a dominant gene overpowering the recessive gene) these 18 will therefore carry the recessive allele (a) hidden within their genetic code. • So natural selection in this example can act on only 1 out of the 19 individuals that carry the allele ( the 1 homozygous individual it can act on but the 18 heterozygous it can not). That leaves 18 individuals who still carry the gene in a recessive hidden form. • Many human diseases have frequencies similar to this. For example, about 1 in 25 Caucasians have a copy of a defective gene for Cystic Fibrosis but show no visible symptoms. Only homozygous individuals, 1 in 2,500, show the disease and thus perish from it. So natural selection only works against this 1 in 2,500.
Natural selection shapes populations affected by phenotypes that are controlled by one or by a large number of genes. A trait that is influenced by several genes is called a polygenic trait. Human height and human skin color are examples of polygenic traits; influenced by dozens of genes at once. Natural selection can change the allele frequencies of many different genes covering a trait. • Natural selection can change the allele frequencies of many different genes governing a single trait, influencing most strongly those genes that make the strongest contribution to the phenotype. Biologists measure a polygenic trait by measuring each individual in a population. These measurements are than used to calculate the average value of a trait for the population as a whole. • Because genes can have many alleles, polygenic traits tend to exhibit a range of phenotypes clustered around an average value. If you were to plot the height of everyone in your class on a graph, the values would probably form a hill-shaped curve called a normal-distribution curve.
Natural selection and the Distribution of Traits: • When selection eliminates one extreme from a range of phenotype possibilities, the alleles promoting this extreme become less common in the population. • In one experiment, when fruit flies raised in the dark were exposed to light, some flew toward the light and some did not. Only those flies with the strongest tendency to fly towards the light were allowed to reproduce. After 20 generations, the average tendency to fly toward the light increased. This is an example of directional selection. • In directional selection, the frequency of a particular trait moves in one direction in a range. Directional selection plays a role in the evolution of single gene traits, such as pesticide resistance in insects.