Download
1 / 23
240 likes | 365 Views
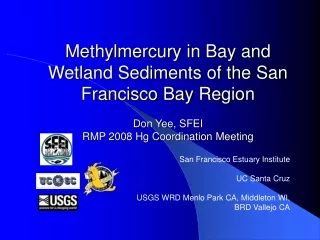
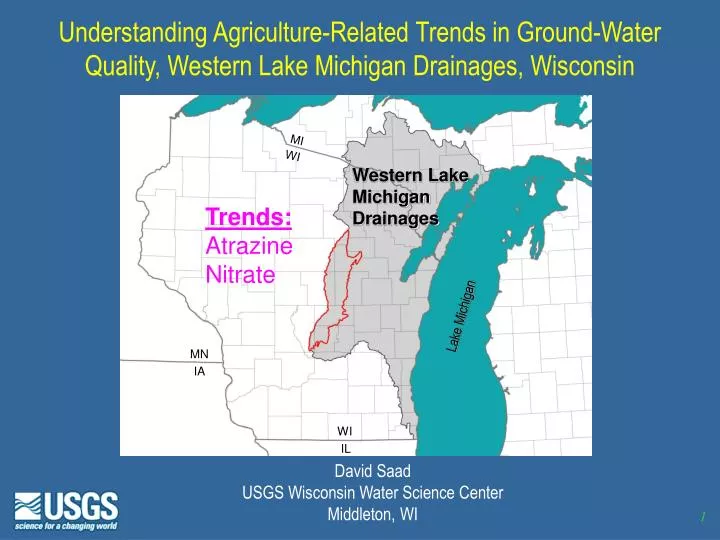
Understanding Agriculture-Related Trends in Ground-Water Quality, Western Lake Michigan Drainages, Wisconsin. MI. WI. Western Lake Michigan Drainages. Trends: Atrazine Nitrate. Lake Michigan. MN. IA. WI. IL. David Saad USGS Wisconsin Water Science Center Middleton, WI.

E N D
Understanding Agriculture-Related Trends in Ground-Water Quality, Western Lake Michigan Drainages, Wisconsin MI WI Western Lake Michigan Drainages Trends: Atrazine Nitrate Lake Michigan MN IA WI IL David SaadUSGS Wisconsin Water Science Center Middleton, WI
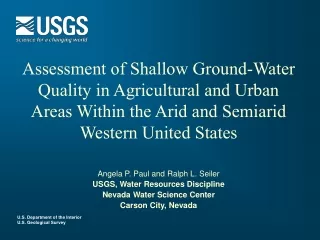
USGS National Water-Quality Assessment Program (NAWQA) NAWQA Objectives: Describe water-quality status and trends and improve our understanding of natural and anthropogenic factors affecting water-quality conditions inmany of theNation’s riversand aquifers
NAWQA Ground-water Land-Use Studies Land-use study objective: Status, trends and understanding of factors that affect shallow ground-water quality in an area of specified land use Presentation focus: Describe trends and factors that affect trends of atrazine and nitrate in shallow ground water in the glacial deposits aquifer in an area of corn/alfalfa rotation
Glacial Deposits Sand and gravel Till Fine grained GW Land-use study area: 30 well network (2” pvc) Glacial Deposits aquifer LU=Corn/alfalfa rotation (dairy) Sampled 1994 and 2002 Water QualityAtrazine or deethyl: 28 of 30 wells Nitrate: 28 of 30 wells Wisconsin Lake Michigan
5 5 5 10 15 EXPLANATION 10 5 year Time of Travel 15 20 25 To understand ag related trends in gw quality need to know: -Input history (ag chem use) -Source of gw -Age of gw -Other factors (climate, chemistry, soils, hydrogeology, well info)
Input history-Wisconsin Atrazine and Nitrogen Use WI Atrazine Rule 1991
To understand trends in ground-water quality need to know: • Input history • Source of ground-water Nearby, upgradient • Age of ground-water Chlorofluorocarbons (CFCs) • Other factors
CFC-based ground-water recharge dates Well 5 CFC-12 Well 24 Well 2 Well 1 Well 15 CFC-11 CFC-113 (Uncertainty based on +/- 1 deg C)
To understand trends in ground-water quality need to know: • Input history • Source of ground-water • Age of ground-water • Other factorsClimate (annual precip), Chemistry (DO), Soils (STATSGO), Hydrogeology (Kh), Well Info (depth, WL)
Land-use Study Trends Analysis:Near-decadal changes (using samples collected in 1994 and 2002)Trends using ground-water age data Correlations to inputs and other factors
Data adjustments to consider when determining trends in water quality:Detection limits If detection limit changes over time, recensor data to a uniform detection limit.Sample variability Are measured differences greater than known sample variability? If not, difference = 0Analytical recovery Does lab reported conc equal environmental conc? Adjust data for poor recovery.
Near-decadal changes: Atrazine + Deethyl atrazine Signed-Rank Test: p=0.02 0.34 Data adjustments: 0.30 -uniform detect limit -sample variability -analytical recovery n=30 n=26
Near-decadal changes: Atrazine + Deethyl atrazine Signed rank: p=0.02 Signed rank: p=0.78 1994 to 2002 Decrease No change Increase Decrease: 13No change: 10Increase: 3 Decrease: 13No change: 0Increase: 13 Data adjustments: -uniform detect limit -uniform detect limit -sample variability -analytical recovery
Near-decadal changes: Nitrate Signed-Rank Test: p=0.04 11.3 Data adjustments: -uniform detect limit -sample variability 6.8 n=30 n=26
1994 to 2002 Near-decadal changes: Nitrate Signed rank: p=0.04 Data adjustments: -uniform detect limit -sample variability Decrease: 6No change: 7Increase: 13
Loess Smooth Loess Smooth Trends using ground-water age data-Atrazine
Loess Smooth Loess Smooth Trends using ground-water age data-Nitrate
Correlation of ground-water concentrations to inputs and other factors: Expected Causal Relationships • Inputs (atrazine/fertilizer use) • Well info (well depth, water level) • Hydrogeology, soil characteristics • Climate (annual precipitation) • Water chemistry (DONO3)
Spearman’s Rho correlations Atrazine + deethyl atrazine: rhop-valueN Soil perm .47 .0003 56 Atrazine use .34 .01 56 Annual precip .30 .02 56
Spearman’s Rho correlations Nitrate: rhop-valueN Fertilizer N use .49 .0001 56 DO .40 .002 56
Summary and Conclusions • Atrazine+deethyl Significant decrease in ground-water concentrations 1994 to 2002 • Nitrate Significant increase in ground-water concentrations 1994 to 2002 • Temporal trends in ground-water concentrations correlated to historical inputs • Atrazine also correlated to precipitation and soil; Nitrate also correlated to DO
Summary and Conclusions • Ground-water age data provides valuable information • Data adjustments are important to consider when determining trends in water quality • To understand trends in ground-water quality need to know more than just changes in concentration.