Download
1 / 47
470 likes | 601 Views
This course focuses on the principles of nutrient recycling within aquatic systems and examines the limiting factors affecting populations in ecological contexts. Activities include field labs in varying environmental settings and independent project setups investigating nutrient dynamics and algal blooms. The course emphasizes understanding how nutrient availability influences aquatic life and examines methods for managing populations effectively through measurement and ecological analysis. Students will engage in hands-on experiments and analyses to understand the complexities of ecosystem interactions.

E N D
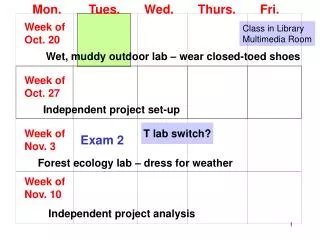
Mon. Tues. Wed. Thurs. Fri. Week of Oct. 20 Class in Library Multimedia Room Wet, muddy outdoor lab – wear closed-toed shoes Week of Oct. 27 Independent project set-up T lab switch? Week of Nov. 3 Exam 2 Forest ecology lab – dress for weather Week of Nov. 10 Independent project analysis
Nutrient recycling in aquatic systems - where is it happening?
sediments not in contact with pelagic zone • most sediments are anaerobic • - reactions are slower Pelagic zone
Water below the thermocline may become depleted of oxygen in summertime Why? Warm (low density) water Cool (dense) water
Low oxygen in facilitates recycling of some nutrients (P and Fe) When oxygen is present, P and Fe combine to form insoluble compounds which remain in the sediments When oxygen is absent, P and Fe are soluble and remain in water – can be mixed up into pelagic zone and taken up by algae
Which nutrient is most limiting to aquatic systems?? What do I mean by most limiting?
P - limitation Housatonic Goal to decrease N input to LIS by 55% in 15 years Where does P-limitation switch to N-limitation? How will changes in nutrient loading affect species composition and frequency of algal blooms? LIS N-limitation
Example of using properties of nutrient recycling in aquatic systems to reduce algal blooms in freshwater systems
How could this reduce algal blooms? Fountain Thermocline oxygen
Nutrient recycling - Terrestrial systems - soil - weathering of rock - decomposition of organic matter - Aquatic systems - sediments and deep water - reactions slow (anaerobic) - decomposition not near uptake
Structure of course Environmental variability Organisms Ecosystems Populations Species interactions Communities Applied Ecological Issues
Outline Introduction How are populations defined and measured? How do populations grow? How does population size change through time and space?
Population - group of organisms of the same species that live in a particular area Population ecology - focus is on changes in the number of individuals over time
Questions asked by population ecologists What limits population growth? What causes variability in population size? How do population in different geographic areas interact? How does the number of adults in a population change relative to the number of juveniles?
Subpopulation – subsets of the population that are separated and have limited exchange How much movement is there between subpopulations?
migration immigration emigration
Humans like to manage population size of other organisms Examples???? In order to manage population size, have to be able to measure it and have to be able to understand what makes population change in size
How are populations measured? • What do we measure? • How?
What do we measure? • Total population size = number of individuals • How they are arranged in space • How many are in each age or size class
Population structure – the density and spacing of individuals within a habitat and the proportions of individuals within each age or size class
Total population size = number of individuals = density x area
Mark – recapture methods • Catch some individuals and mark them • Put them back and let them mix • Recapture some individuals and count how many are marked • Ratio of marked to unmarked gives an estimate of population size
N = nM/x N = total number of individuals M = number of marked individuals n = number of recaptured individuals x = the number of recaptured individuals who were marked
Mark – recapture methods Assumptions • Population size is the same on the days you marked and recaptured. • All individuals have equal probability of being captured. • Marked individuals were well mixed before recapture.
What do we measure? • Total population size = number of indivduals • How they are arranged in space • How many are in each age or size class
Figure 13.5 There is a simple statistical test to test for distribution Mechanisms?
What do we measure? • Total population size = number of indivduals • How they are arranged in space • How many are in each age or size class
Outline Introduction How are populations defined and measured? How do populations grow? How does population size change through time and space?
Growth = births – deaths + immigration – emigration When calculating growth rate, usually just seeing change in numbers over time
Populations grow by multiplication rather than by addition Just like interest in the bank
Exponential growth • new individuals are added (born) to population continuously • r = per capita growth rate = contribution of each individual in population
Exponential growth dN/dt = rN Rate at which individuals are added = growth rate on a per individual basis x population size = derivative of exponential equation = slope of line
Exponential vs. Geometric Growth Exponential – continuous reproduction - growth is smooth curve Geometric – discrete breeding seasons - calculate growth at discrete intervals
Geometric growth Growth rate = = population size at one time point/ size at previous time point N (t+1) = N(t) N(t) = N(0) t
Geometric growth: N(t) = N(0) t Exponential growth: N(t) = N(0) ert • = er Ln = r
Figure 14.5 Per capita growth rate = constant Rate of increase= dN/dt, increases with N Exponential