Download
1 / 36
370 likes | 524 Views
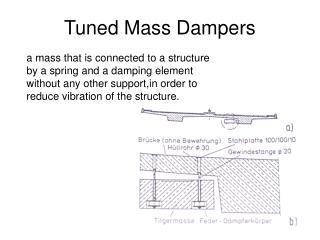
Gilles OUDIN Multitech Vibration Control 9 Rue du Gué – 92 500 Rueil-Malmaison, France Email : multitech-fr@wanadoo.fr phone :+33-1.6.63.35.82.43. Tuned Mass Damper on a concrete stack Experience after one year of site measurement. Index. ABSTRACT 3 ORIGIN OF THE PROBLEM 4

E N D
Gilles OUDIN Multitech Vibration Control 9 Rue du Gué – 92 500 Rueil-Malmaison, France Email : multitech-fr@wanadoo.frphone :+33-1.6.63.35.82.43 Tuned Mass Damper on a concrete stackExperience after one year of site measurement
Index ABSTRACT 3 ORIGIN OF THE PROBLEM 4 2) DAMPER MAIN DESIGN PARAMETERS 7 3) MONITORING RESULTS 12 measures on May 8 th,2007 12 measures on Sept 21 th ,2007 16 measures on Sept 24 th, 2007 20 measures on Dec 4 th ,2007 22 measures on Jan 31 th ,2008 25 4) CONCLUSIONS 29
1) ABSTRACT This paper present the results of in situ monitoring of a concrete stack equipped with a Tuned Mass Damper. The TMD was installed in order to avoid interference effect on a old 183 m (600 ft ) concrete stack due to the construction of a new concrete stack at 110 m (360 ft) distance. This paper is the continuation of the one presented by Charles Goddard last September. According to Charles Goddard paper presented in Esberg last Sept :< TMD on concrete stacks have been largely unsuccessful in the UK > …. but after one year site monitoring this specific TMD is working perfectly even if in many aspects the TDM Theory is not respected .
2) ORIGIN OF THE PROBLEM The old chimney at the Rugeley Power Station was constructed around 1968 and consists of a 183m high reinforced concrete windshield, internally protected by a sectional, acid resisting brickwork, lining supported from concrete corbels cast monolithically with the shell. The windshield tapers from an external diameter of 9.4m at the top to 15.7m at the base. Its outer surface has suffered from the usual environmental actions and an external reinforced concrete cladding was installed in 1998 over the upper 24m.
Due to the installation of a flue gas desulphurisation plant, a new 183m chimney was built in the vicinity of the existing chimney, at a distance of 110m and a bearing of 218, approximately in the southwest direction of the prevailing winds in the UK..A a study of wind loads and interference effects was conducted, by J.Galsworthy and B.Vickery, which concluded that ‘interference effects associated with the construction of the new chimney significantly increase loads on the existing chimney’. Fig 1 : elevation of the old chimney
The study indicated that maximum response of the existing chimney would occur with free-stream wind speed of 31m/s and would depend strongly on the damping capacity. The existing chimney was constructed at a time when high yield reinforcing steel was beginning to be used and laboratory testing of steel samples showed that mild steel reinforcing has been used. As a result, it was determined that the design capacity of the chimney would be exceeded over a substantial length at the critical wind speed for a damping ratio of 1% .It was decided first to install a response monitoring system capable of alerting operations staff at threshold response levels and later to install a tuned mass damper to increase the chimney damping capacity and reduce interference-induced loads to below design capacity. Fig 2 : new concrete stack under construction at 110 m from the old concrete stack
2) DAMPER MAIN DESIGN PARAMETERS • Estimated first mode frequency based on video observation 0.34 Hz (to get this frequency based on the data of the stack we have to reduce by about 20% the Young Modulus : this old stack is widely cracks and damaged) • Natural damping ratio : 0.7 % of the critical damping (measured just before damper installation) • Modal mass of the stack at the first natural frequency 1 281 000 kg • Max. estimated dynamic displacement at the TMD’s level : ± 265 mm • Moving mass of the TMD : 42 000 kg =3.27% of modal mass only • Target -> get 3% damping ratio with the TMD
CAN WE TRUST THE DESIGN CODES ??? Above :recommendation for structural damping for different type of structures according latest Euronome 3 % for a concrete stack where only 0.7 % have been measured on an old crack stack One another stack in France 140 m, D / d =9.50 m/5.50 m, a damping of only 0.6% was measured and the stack was so cracked and damaged that we had to reduced the Young Modulus to 20 000 Mpa to fit the measured frequency Advice :do not trust Codes but measure the risk
Estimation for 3% Damping Peak dispact 150 mm 1% Damping 2% Damping 5% Damping Fig 3 :Variation of the peak tip displacement with wind speed of 1%, 2% and 5% damping (J.Galsworthy and B.Vickery)
* 4.20 Fig 4 : theoretical effectiveness of the damper at the optimum according Den Hartog (4.8% damping – max structure movement 35 mm – max damper movement 150 mm). Compare to previous figure the structure displacement is much smaller. Is theory of TMD applicable?
Fig 6 : Charles Goddard , and Paul Sayer during TMD installation
3) MONITORING RESULTS MEASURES ON MAY 8TH 2007 Fig 7 : Acceleration on Y axis versus X axis . The prevailing direction is X axis
Fig 8 : Time history for 3780 s Fig 9 : Spectra – main frequency 0.316 s
Yt=Yo* Exp( - **t) 6 cycles Fig 10 : zooming around 800 s – damping 3.6% Max structure displacement 9 mm Three methods to estimate the damping : . Special software to average damping over long term !!! Not of interest? . Damping =1/(2)*{ 1/6* LN(0.0.34/0.009)}=3.53% based on 6 cycles (left) . Estimation of the best suitable (right) to fit the decay curve
Fig 11 : zooming around 2700 s – damping 5.3% Max structure displacement 22 mm
MEASURES ON SEPT 21TH 2007 Fig 12 : Acceleration on Y axis versus X axis . The prevailing direction is Y axis
Fig 13 : Time history for 7500 s Fig 14 : Spectra – main frequency 0.324 s
Fig 15 : zooming around 140 s – damping 7.1% Max structure displacement 25 mm
Fig 16 : zooming around 3060 s damping 3.5% Max structure displacement 32 mm
MEASURES ON SEPT 24 TH 2007 Fig 17 : Acceleration on Y axis versus X axis . The prevailing direction is Y axis
Fig 18 : Time history for 3650 s Fig 19 : Spectra – main frequency 0.319 s
Fig 20 : zooming around 1450 s damping 4.6% Max structure displacement 18 mm
MEASURES ON DEC 4 TH 2007 Fig 21 : Acceleration on Y axis versus X axis . The prevailing direction is Y axis
Fig 22 : Time history for 8050 s Fig 23: Spectra – main frequency 0.328 s
Fig 24 : zooming around 3800 s – damping 3.4% Max structure displacement58 mm Fig 25 : zooming around 4150 s – damping 3.3% Max structure displacement 48 mm
MEASURES ON JAN 31 TH 2008 Fig 26 : Acceleration on Y axis versus X axis . The prevailing direction is Y axis
Fig 27 : Time history for 3950 s Fig 28 : Spectra – main frequency 0.327 s
Fig 29 : zooming around 125 s damping 3.4% - max structure displacement 149 mm !!! Rq = 4.20 * 149 = 625 mm !!!
Fig 30 : zooming around 3690 s damping 6.5% !!! Max structure displacement 110 mm
4) CONCLUSIONS Fig 31 : Damping versus structure acceleration at top The damping average is much over 3%. In some occasion the decay curve is not finished when a new wind excitation occurs and as a result the apparent damping is smaller. In case where no excitation occurs during the decay curve the damping value are much over the 3% and above TMD theory !!!!
Fig 32 : Damping versus stack displacement at damper elevation
The damping average is much over 3% . In some occasion the decay curve is not finished when a new wind excitation occurs and as a result the apparent damping is smaller. In case where no excitation occurs during the decay curve the damping value are much over the 3% This TMD prove to be effective even with a small moving mass/modal mass ration of 3.27%. One of interest of this damper is due to the fact that it start working with very small displacements so that never large excitation could occur. The max recorded structure amplitude is 149 mm with an acceleration of 0.613 m/s . This value is exactly the max predicted from the interference study. It means that in only 11 months the max excitation has been reached at least two time. From the previous results damping of 5% or more could be obtained with this type of dampers
It is clear that the TMD theory is not 100% applicable : • . Structure movement displacements larger than expected with TMD theory • . Moving mass displacements smaller than expected • . In some occasion recorded damping are higher than theory • . explanation : TMD theory is based on sinusoidally varying force, but the natural wind does’nt follow this assumption • TMD which are widely used for steel stacks can be used also for concrete stacks for different purposes : • . Interferences effects between nearby structures . Optimisation of concrete stacks with respect to crosswind vibration . Optimisation of concrete stack with respect of earthquake . Cover risks when theory and Code are uncertain . Rehabilitation of old concrete stacks • The Rugeley TMD is the largest effective damper of this type in the World for a concrete stack
Acknowledgment : Charles Goddard, Paul Sayer , Gary Eastman - Bierrum Int Professor James MW Brownjohn of the university of Sheffiield Professor J.Galsworthy and B.Vickery