Download
1 / 37
370 likes | 419 Views
Data Analysis 17. Data are obtained from a random sample of adult women with regard to their ages and their monthly expenditures on health products. The resulting regression equation is: E xpenditure = 43 + 0.23(Age) with r = 0.27.

E N D
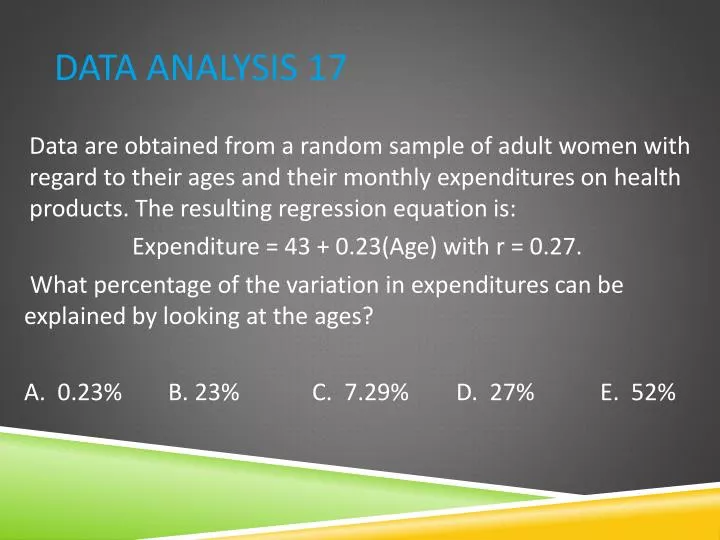
Data Analysis 17 Data are obtained from a random sample of adult women with regard to their ages and their monthly expenditures on health products. The resulting regression equation is: Expenditure = 43 + 0.23(Age) with r = 0.27. What percentage of the variation in expenditures can be explained by looking at the ages? A. 0.23% B. 23% C. 7.29% D. 27% E. 52%
Data Analysis 18 Given these parallel boxplots, which of the following are true? (choices on next slide)
I. The ranges are the same. II. The interquartile ranges are the same. III. Both sets are skewed to both lower and higher values. A. I only B. II only C. III only D. I and II E. I, II, and III
Data Analysis 19 Suppose the average score on a national exam is 500 with a standard deviation of 100. If each score is increased by 20 and the result is increased by 10%, what are the new mean and standard deviation? A. µ = 570, σ = 100 B. µ = 570, σ = 110 C. µ = 572, σ = 100 D. µ = 572, σ = 110 E. µ = 572, σ = 132
Data Analysis 20 Which of the following statements about residuals are true? I. The mean of the residuals is always zero. II. The regression line for a residual plot is a horizontal line. III. The standard deviation of the residuals gives a measure of how the points in the scatterplot are spread around the regression line. A. I and II B. I and III C. II and III D. I, II, and III E. None of the above gives the complete set of true responses.
Data Analysis 21 Consider the following picture of revenue over 3 years. Which of the statements on the following slide are true?
I. Revenue dropped approximately in half from 2004-2005 and then approximately in half again from 2005-2006. II. The choice of labeling makes for a misleading revenue picture. III. The above picture is not a histogram. A. I only B. II only C. III only D. II and III E. None of the above gives the complete set of true responses.
Data Analysis 22 If every man married a woman who was exactly 3 years younger than he, what would be the correlation between the ages of married men and women? A. Somewhat negative B. 0 C. Somewhat positive D. Nearly 1 E. 1
Data Analysis 23 In which of the following histograms is the mean less than the median?
Data Analysis 24 A teacher is teaching two AP Statistics classes. On the final exam, the 25 students in the first class averaged 87, while the 30 students in the second class averaged 98. If the teacher combines the classes, what will the average final exam score be? A. 92B. 92.5 C. 93 D. 94.5 E. 95
Data Analysis 25 Which of the following statements are true? I. Both dotplots and stemplots can show symmetry, gaps, clusters, and outliers. II. In histograms, relative areas correspond to relative frequencies. III. In histograms, frequencies can be determined from relative heights. A. II only B. I and II C. I and III D. II and III E. I, II, and III
Data Analysis 26 The number of students taking AP Statistics at a high school during the years 2000-2007 is fitted with a least squares regression line. The graph of the residuals and some computer output is as follows:
Dependent variable is: Students s = 9.758 R-sq = 93.4% R-sq (adj) = 92.4% Variable Coeff s.e. t p Constant 11 6.299 1.75 0.1313 Years 13.9286 1.506 9.25 0.0001 How many students took AP Statistics in the year 2003? A. 47 B. 48 C. 52 D. 53 E. 58
Data Analysis 27 Suppose the regression line for a set of data, ŷ = a + 4x, passes through the point (1,3). If x and ȳ are the sample means of the x- and y-values, respectively, then ȳ = A. X B. 4x C. 3 + 4x D. 2 + x E. -1 + 4x
Data Analysis 28 Consider the scatterplot of midterm and final exam scores for a class of 20 students. Which of the following statements on the next slide is true?
I. The same number of students scored 100 on the midterm as did on the final. II. The same percentage of students scored below 50 on each exam. III. Students who scored higher on the midterm tended to score higher on the final. A. I and II B. I and III C. II and III D. I, II, and III E. None of the above gives the complete set of true responses.
Data Analysis 29 If the standard deviation of a set of observations is 0, you can conclude: A. That there is no relationship between the observations. B. That the average value is 0. C. That all observations are the same value. D. That a mistake in arithmetic has been made. E. None of the above.
Data Analysis 30 Which of the following statements about the correlation r are true? I. The correlation and the slope of the regression line always have the same sign. II. A correlation of -0.32 and a correlation of +0.32 show the same degree of clustering around the regression line. III. A correlation of 0.78 indicates a relationship that is 3 times as linear as one for which the correlation is 0.26. A. I and II B. I and III C. II and III D. I, II, and III E. None of the above gives the complete set of true responses.
Data Analysis 31 These dotplots for randomly selected male and female students at a particular high school show the number of times per week they eat at fast food restaurants. Which of statements on the following slide are true?
I. One distribution is roughly symmetric; the other is skewed left. II. The difference in their means is less than the difference in their medians. III. The ranges are the same. A. I and II B. I and III C. II and III D. I, II, and III E. None of the above gives the complete set of true responses.
Data Analysis 32 Suppose the correlation between two variables is r = 0.28. What will the new correlation be if 0.17 is added to all value of the x-variable, every value of the y-variable is doubled, and the two variables are interchanged? A. 0.28 B. 0.45 C. 0.56 D. 0.90 E. -0.28