Download
1 / 23
230 likes | 356 Views
SWRCB Modeling I Historical Modeling. Tara Smith, Delta Modeling Section Department of Water Resources. Bob Suits Jim Wilde. Parviz Nader-Tehrani Bijaya Shrestha. Acknowledgements. Background. Cease and Desist Hearings – Fall 2005 Approach

E N D
SWRCB Modeling I Historical Modeling Tara Smith, Delta Modeling Section Department of Water Resources
Bob Suits Jim Wilde Parviz Nader-Tehrani Bijaya Shrestha Acknowledgements
Background • Cease and Desist Hearings – Fall 2005 • Approach • Investigated Water Quality Degradation from Vernalis to Brandt Bridge • Modified SWP Exports for Historical DSM2 Simulations • Southern Delta Salinity Workshop – Winter 2007 • Approach • Provided Different Visuals to Help Explain Flow Patterns and Water Quality • Expanded CDO Modified Historical Simulations to Include Increased Sacramento Flow Simulations and No Barrier No Export Simulations • Modified Planning Simulations to Demonstrate Flow Patterns for Export Variations, Barrier and Permanent Gate Installations, and Increased Sacramento Flow
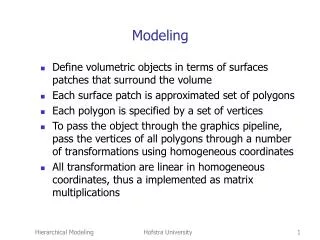
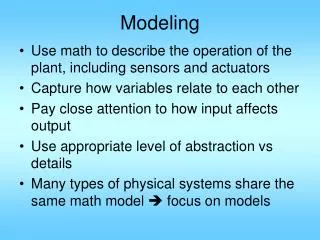
Objective of Presentation Investigate whether State operations (changing Sacramento River Flow and/or Pumping) can influence the South Delta Salinity Show flow patterns in the Delta Show the effects of drastic changes in project operations
Flow Pattern Without Exports (no temporary barriers) Influence of Sacramento River downstream of objective locations Exports downstream of objective locations
Flow Pattern With Exports (no temporary barriers) Influence of Sacramento River downstream of objective locations Exports downstream of objective locations
Flow Pattern With Exports (with two agricultural temporary barriers and barrier at Head of Old River)
Flow Pattern With Exports (with three agricultural temporary barriers)
Modeled SWP Export Effects on Salinity (as Compared to Modeled Historical) Can affect but can’t control salinity by changing SWP exports
Modeled Export, Barriers, and Sacramento Flow Effects on Salinity DSM2 Simulations (Appendix C) 2002 Historical simulation No CVP or SWP exports and no temporary barriers (modified 2002 historical) No SWP exports and no temporary barriers (modified 2002 historical) Additional Sacramento Flow of 5000 cfs ,Apr through Aug (modified 2002 historical) Why 2002? Builds upon work presented previously See how well the model performs (results can be compared with observed data)
DSM2 Simulations and Observed Data Observed DSM2 Historical Temporary Barrier Installation
Four Simulations DSM2 2002 Historical No SWP and CVP exports, no barriers No SWP exports and no barriers Additional Sacramento Flow (5000 cfs) DSM2 Simulations
Old River at Tracy Road Historical Simulation (exports, no barriers) April 1 - 15 No SWP,CVP exports; no barriers, April 1 –15
Old River at Tracy Road Historical Simulation (exports, barriers) April 15- May 24 No SWP,CVP exports; no barriers, April 15 – May 24
Old River at Tracy Road Historical Simulation (exports, barriers) June 7-30, 2002 No SWP,CVP exports; no barriers, June 7-30, 2002
RMID040 (one mile downstream of Old River at Middle River) Differences reflect movement of water upstream due to barriers DSM2 Simulations (cont)
Brandt Bridge No Significant difference in results between the four simulations DSM2 Simulations (cont)
Conclusions Water Quality in the South Delta is primarily dominated by the San Joaquin River and in Delta Sources Reduction in exports and/or additional Sacramento flows alone cannot cause significant changes in water quality at the south Delta objective locations. Circulation of “Sacramento side” water can be moved upstream to affect the water quality at two of the three objective locations by the use of temporary barriers or permanent gates. Water Quality at Brandt Bridge cannot be significantly affected by changes in Sacramento flow, export reduction, or gates