Download
1 / 15
150 likes | 291 Views
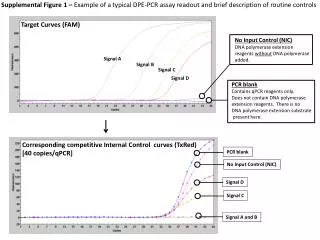
Supplemental Figure 1 – Example of a typical DPE-PCR assay readout and brief description of routine controls. Target Curves (FAM). No Input Control (NIC) DNA polymerase extension reagents without DNA polymerase added. Signal A. Signal B. Signal C. Signal D. PCR blank

E N D
Supplemental Figure 1 – Example of a typical DPE-PCR assay readout and brief description of routine controls Target Curves (FAM) No Input Control (NIC) DNA polymerase extension reagents without DNA polymerase added. Signal A Signal B Signal C Signal D PCR blank Contains qPCR reagents only. Does not contain DNA polymerase extension reagents. There is no DNA polymerase extension substrate present here. Corresponding competitive Internal Control curves (TxRed) [40 copies/qPCR] PCR blank No Input Control (NIC) Signal D Signal C Signal A and B
Supplemental Figure 2 (A) Example of “contaminant” DNA polymerase activity detected in DNA polymerase extension stock reagents and its elimination/reduction after reagent pre-heat treatment. (B) UDG within the qPCR mastermix is essential for elimination of Taq-dependent background noise. A dilution of UDG within the qPCR mastermix is also presented. A No Input Control DPE-PCR curves from duplicate DNA polymerase extension reactions containing 3 separate lots of BSA +/- pre-heat treatment Lot 1 (-) Lot 3 (-) Lot 2 (-) Lot 3 ( + ) Lot 1 and 2 ( + ) B No Input Control DPE-PCR curves from qPCR reactions containing the indicated amounts of UDG No UDG 0.00012 Units UDG (1:10,000) 0.012 Units UDG (1:100) 1.2 Units UDG (standard)
Supplemental Figure 3 Raw data used to generate linearity graphs for DNA Pol I LOD depicted in Figure 2B Raw data from triplicate reactions of Figure 2C A B
Supplemental Figure 4 (A) Raw data from triplicate DPE-PCR reactions containing DNA pol I reactions with dCTP or ddCTP shown in Figure 2D. PCR blank controls are included to demonstrate that the minor amounts of ddCTP carried from the DNA polymerase extension reaction into the qPCR reaction are not inhibitory for Taq. See Supplemental Figure 1 for an example of a typical DPE-PCR readout. (B) Corresponding Target (FAM) curves (C) Corresponding competitive Internal Control (TxRed) curves B Target (FAM) curves Pol-dCTP Pol-ddCTP and PCR blanks A C Competitive Internal Control curves (TxRed) Pol-ddCTP and PCR blanks 40 copies of competitive Internal Control DNA is still detected in the presence of ddCTP carryover Pol-dCTP “Flattened” competitive Internal control curves derived from Pol-dCTP are given a Ct of ≈ 32.5 by SMART Cycler software
Supplemental Figure 5 Raw data from triplicate reactions used to generate linearity graphs for E. coli in Figure 4B Results from triplicate cfu plating (C) Raw data from triplicate reactions of E. coli gene specific PCR. Data was generated from the same lysates used to determine DNA polymerase activity A B C ND = None Detected NA = Not Applicable TNTC = Too Numerous To Count
Supplemental Figure 6 Raw data from triplicate reactions used to generate linearity graphs for S. aureusin Figure 4D Results from triplicate cfu plating (C) Raw data from triplicate reactions of S. aureusgene specific PCR. Data was generated from the same lysates used to determine DNA polymerase activity A B C ND = None Detected NA = Not Applicable TNTC = Too Numerous To Count
Supplemental Figure 7 Raw data from triplicate reactions used to generate dCTP rescue graphs for E. coli in Figure 5C Raw data from triplicate reactions of E. coli gene specific PCR. Data was generated from the same lysates used to determine DNA polymerase activity A B No inhibition of competitive qPCR internal control due to ddCTP carryover * Depicted as 45 Ct in graph to provide baseline for dCTP rescue curves. No actual Ct was calculated by the SmartCycler ND = None Detected
Supplemental Figure 8 Raw data from triplicate reactions used to generate dCTP rescue graphs for S. aureusin Figure 5F Raw data from triplicate reactions of S. aureusgene specific PCR. Data was generated from the same lysates used to determine DNA polymerase activity A B No inhibition of competitive qPCR internal control due to ddCTP carryover * Depicted as 45 Ct in graph to provide baseline for dCTP rescue curves. No actual Ct was calculated by the SmartCycler ND = None Detected
Supplemental Figure 9 Source and growth media for the 17 additional microorganisms tested by DPE-PCR A
Supplemental Figure 10 - Parallel plating results for 17 additional microorganisms tested
Supplemental Figure 11 - DPE-PCR results for 17 additional microorganisms tested
Supplemental Figure 12 - Selected DPE-PCR curves for 6 additional gram negative bacteria P. aeruginosa E. cloacae e4 e3 e2 e1 e0 NIC e4 e3 e2 e1 e0 NIC H. influenzae A. baumannii e4 e3 e2 e1 e0 e4 e3 e2 e1 e0 NIC NIC S. marcescens K. pneumoniae e4 e3 e2 e1 e0 e4 e3 e2 e1 e0 NIC NIC Dan Z. 12-23-11
Supplemental Figure 13 - Selected DPE-PCR curves for 6 additional gram positive bacteria E. faecium S. pyogenes e4 e3 e2 e1 e0 e4 e3 e2 e1 e0 NIC NIC E. faecalis S. pneumoniae e4 e3 e2 e1 e0 e4 e3 e2 e1 e0 NIC NIC S. agalactiae S. epidermidis e4 e3 e2 e1 e0 e4 e3 e2 e1 e0 NIC NIC
Supplemental Figure 14 C. glabrata C. krusei - Selected DPE-PCR curves for 5 Candida species e5 e3 e4 e5 e4 e3 e2 e2 e1 e1 NIC NIC C. parapsilosis C. albicans e5 e4 e3 e3 e2 e4 e1 e5 e2 e1 NIC NIC C. tropicalis e4 e3 e2 e5 e1 NIC Dan Z. 12-23-11
Supplemental Figure 15 Primer and probe sequences used for gene specific PCR-mediated detection of E. coli genomic DNA Primer and probe sequences used for gene specific PCR-mediated detection of S. aureusgenomic DNA Thermoprofile for both gene specific PCR assays A uidA gene of E. coli Forward Primer: 5’ caccgacatgtggagtgaag 3’ Reverse Primer: 5’ cgggtgaagatccctttctt 3’ Probe (5’ FAM labeled): 5’ ccgcgtctttgatcgcgtca 3’ B nuc gene of S. aureus Forward Primer: 5’ ctgaagcaagtgcatttacgaa 3’ Reverse Primer: 5’ agccaagccttgacgaactaa 3’ Probe (5’ FAM labeled): 5’ tatgctgatggaaaaatggtaaacaaagc 3’ C Pre PCR45 cycles 95 ° C 95 ° C 5 min. 5 sec. 60 ° C 1 min.